FIGURE 4.

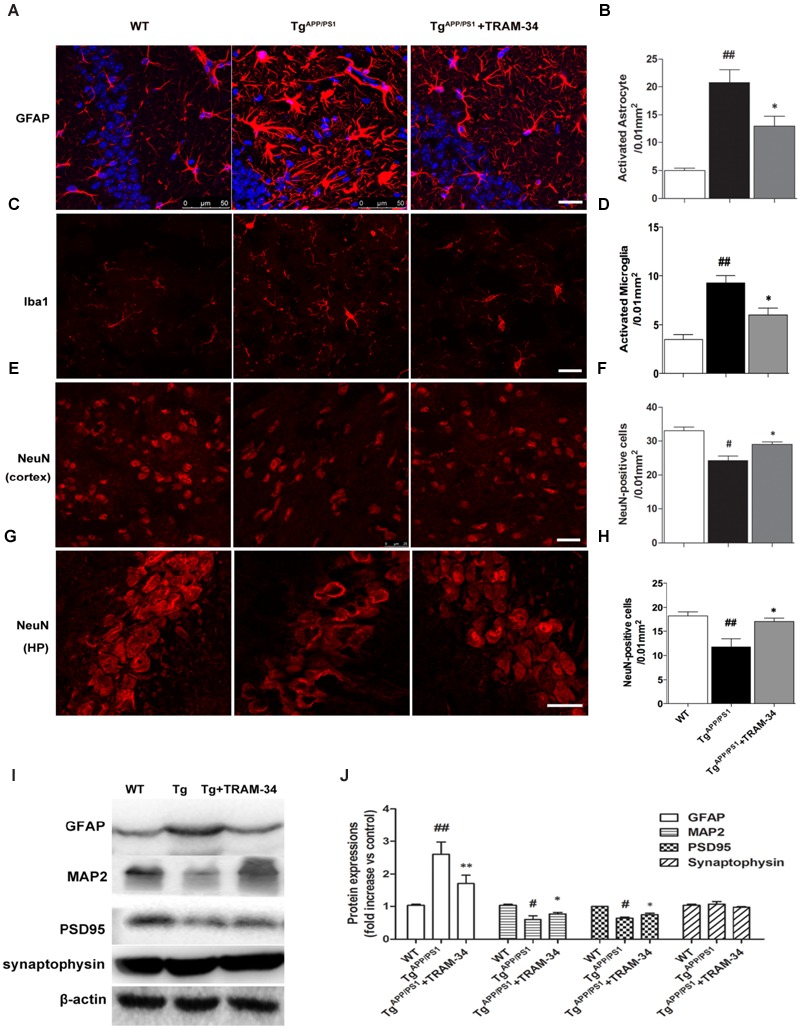
Blockade of KCa3.1 attenuated gliosis and neuronal loss in TgAPP/PS1 mice. (A) Representative images of GFAP-immunoreactive astrocytes from hippocampal regions of WT and Tg mice, with and without TRAM-34 (120 mg/kg/d). (B) Quantification of reactive astrocyte number/0.01 mm2 in hippocampus (n = 6–8). (C) Iba1 immunoreactivity of activated microglia from hippocampal regions of WT and Tg mice, with and without TRAM-34 (120 mg/kg/d). (D) Quantification of activated microglial number/0.01 mm2 in hippocampus (n = 6–8). NeuN immunoreactivity of neurons in (E) cortex and (G) hippocampal regions of WT and Tg mice, with and without TRAM-34 (120 mg/kg/d). Quantification of neuron number/0.01 mm2 in (F) cortex and (H) hippocampus (n = 6–8). Data represent mean ± SEM. #p < 0.05, ##p < 0.01 compared with WT mice. ∗p < 0.05, versus Tg mice (n = 6–8). (I) Western blot analysis using antibodies to astrocyte marker GFAP, dendritic protein MAP2, post-synaptic protein PSD95, and pre-synaptic protein synaptophysin. (J) Results are presented as mean ± SEM (n = 4). #p < 0.05, ##p < 0.01 compared with WT mice. ∗p < 0.05, ∗∗p < 0.01 compared with Tg mice. Tg, TgAPP/PS1. Scale bar: 25 μm.
