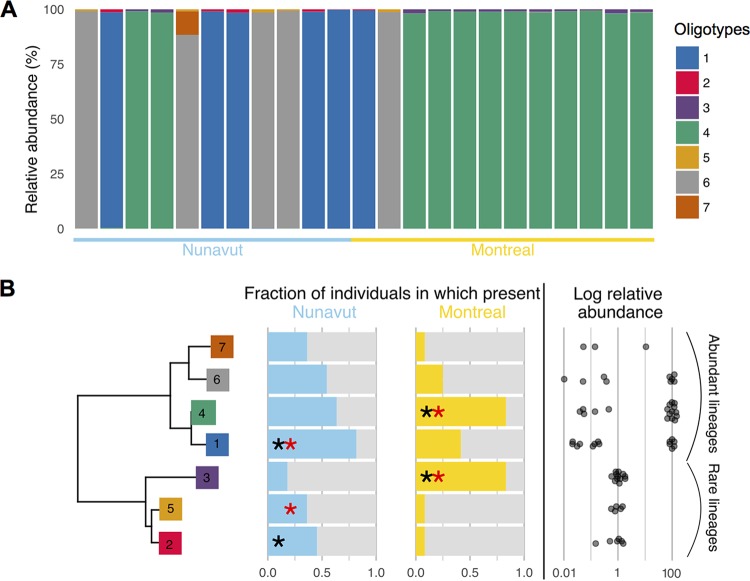
FIG 6 .
Two distinct Akkermansia lineages, each containing strains associated with geography and diet. (A) Akkermansia strains (oligotypes 1 to 7) across samples (individuals). Only individuals with at least 100 Akkermansia reads are included. Percentages are relative to the total number of Akkermansia reads in the individual. Most individuals were dominated by one single strain (representing >88% of reads) of 7 strains identified. (B) Neighbor-joining tree (left) of oligotype sequences, with the fraction of individuals in which the oligotype is present, and its mean abundance within individuals (right). Stars indicate significant associations of oligotypes with geography (Nunavut versus Montreal; black stars) and diet (Western versus Inuit diet; red stars) (LEfSe; P < 0.05 after correction for multiple tests; Table S1H).

