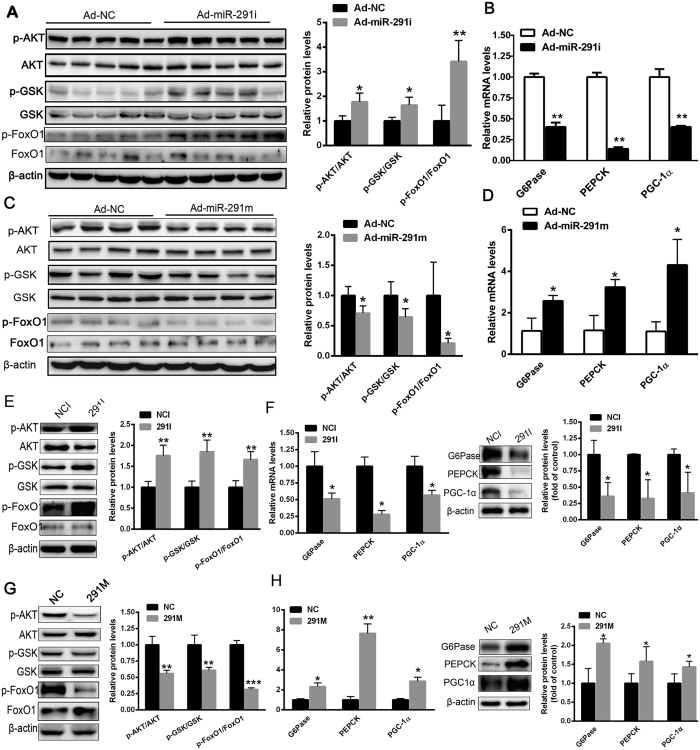
Figure 4. MiR-291b-3p suppresses insulin-stimulated AKT/GSK/FoxO1 signaling and increases expression of gluconeogenic genes in hepatocytes.
(A) The phosphorylation of AKT/GSK/FoxO1 in the liver of HFD-fed mice on 7 days after injection of Ad-miR-291i or Ad-NC. Full-length blots/gels are presented in Supplementary Figure 1. (B) The mRNA levels of gluconeogenesis genes including G6Pase, PGC-1α and PEPCK in the liver of HFD-fed mice on 7 days after injection of Ad-miR-291i or Ad-NC. (C) The phosphorylation of AKT/GSK/FoxO1 in the liver of C57BL/6 J mice on 7 days after injection of Ad-miR-291m or Ad-NC. Full-length blots/gels are presented in Supplementary Figure 2 and cropping lines are indicated in red color. (D) The mRNA levels of G6Pase, PGC-1α and PEPCK in the liver of C57BL/6 J mice on 7 days after injection of Ad-miR-291m or Ad-NC. (E) The phosphorylation of AKT/GSK/FoxO1 in the NCTC1469 cells transfected with miR-291b-3p inhibitor (291i). Full-length blots/gels are presented in Supplementary Figure 3 and cropping lines are indicated in red color. (F) The mRNA and protein levels of gluconeogenesis genes in the NCTC1469 cells transfected with 291i. (G) The phosphorylation of AKT/GSK/FoxO1 in the NCTC1469 cells transfected with miR-291b-3p mimic (291 m). Full-length blots/gels are presented in Supplementary Figure 4 and cropping lines are indicated in red color. (H) The mRNA and protein levels of G6Pase, PGC-1α and PEPCK in the NCTC1469 cells transfected with 291 m. Data are expressed as mean ± SEM (n = 5). *P < 0.05; **P < 0.01 vs. control group.

