
Figure 4.
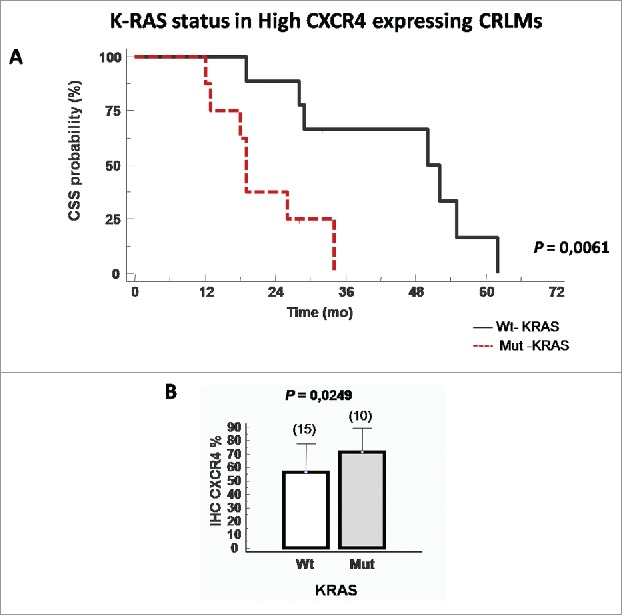
CXCR4 protein correlates with K-RAS mutational status. (A) Cancer specific survival (CSS) Kaplan–Meier curves described the patients groups at high and low risk of death according to KRAS mutational status. (CSS wt-KRAS; N = 10, median survival 51 mo vs mut-KRAS; N = 8, median survival 19 mo, p = 0.0061). (B) Correlation between CXCR4 value and KRAS mutation.