
Figure 3.
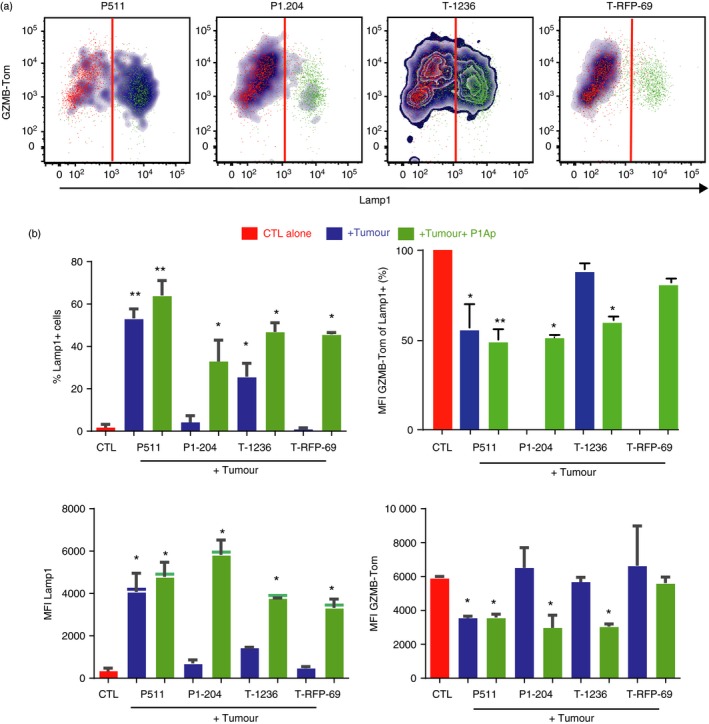
Differential extent of degranulation of TCRP1A‐GZMB‐Tom CTL induced by different P1A‐expressing tumour cells. CTL were incubated alone (red) or mixed with the tumour cells (untreated: blue, or pre‐loaded with peptide P1Ap: green) at a 1 : 1 ratio in 100 μl culture medium containing the anti‐Lamp1‐APC monoclonal antibody (mAb), before mild centrifugation and 30 min incubation at 37°. FACS analysis of anti‐Lamp1 mAb and GZMB‐Tom fluorescence was performed. (a) Density plots representing the binding of Lamp1 mAb and the expression of GZMB‐Tom on the CTL. (b) CTL degranulation measured by increase in Lamp1 staining on the CTL, expressed as % Lamp1‐positive CTL (upper left graph) and MFI of Lamp1 on all CTL (lower left graph) or by decrease in GZMB‐Tom fluorescence, expressed as % of MFI of GZMB‐Tom on Lamp‐1‐positive CTL (upper right graph, where MFI for all CTL alone was set at 100%) and MFI of GZMB‐Tom on all CTL (lower right graph). Results are the mean of three (without peptide) or two (with peptide) experiments. Statistical analysis was performed using t‐test: *P < 0·05; **P < 0.01.