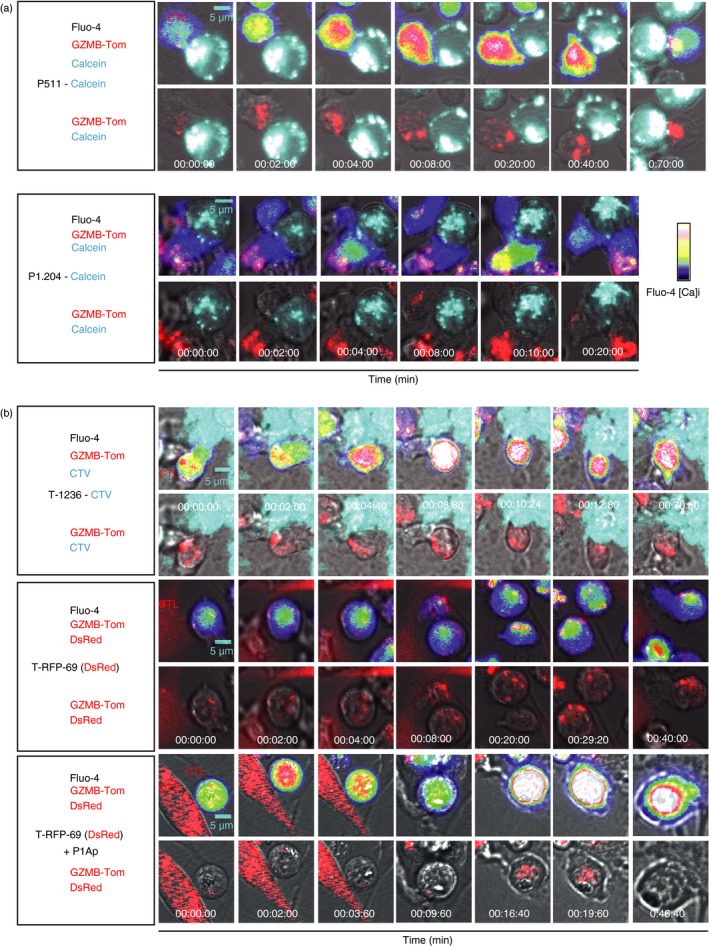
Figure 4.

Visualization of the kinetics of CTL activation and granule re‐localization upon CTL/tumour cell contact by video microscopy. Images from video microscopy show Ca2+ fluxes and fluorescence of GZMB‐Tom containing granules in Fluo‐4‐labelled TCRP1A‐GZMB‐Tom CTL added to various tumour targets. The first image corresponds to that before the first increase in Ca2+ (except for the P1.204 P1A‐negative tumour cells). (a) P511 and P1.204 non‐adherent tumour cells were labelled with Violet Calcein and deposited onto polylysine‐activated Labtek wells, before addition of the CTL. Upper images show Fluo‐4 and GZMB‐Tom fluorescence in the CTL and Calcein Violet fluorescence in the tumour cells. Lower images are devoid of Fluo‐4 fluorescence to better visualize GZMB‐Tom. (b) Adherent tumour cells T‐1236 and T‐RFP‐69 were grown on Labtek wells 2 days before the experiment. T‐1236 cells were labelled with CTV whereas T‐RFP‐69 cells endogenously express DsRed. When indicated (two last lanes), T‐RFP69 cells were loaded with peptide P1Ap. For T‐1236 tumour cells, upper images show Fluo‐4, GZMB‐Tom and Calcein Violet fluorescence and lower images are devoid of Fluo‐4 fluorescence. For T‐RFP‐69 cells, upper images show Fluo‐4, GZMB‐Tom and DsRed fluorescence, lower images are devoid of Fluo‐4 fluorescence. Video microscopy recordings (90 min at 37°) were performed and analysed as described in Materials and methods.
