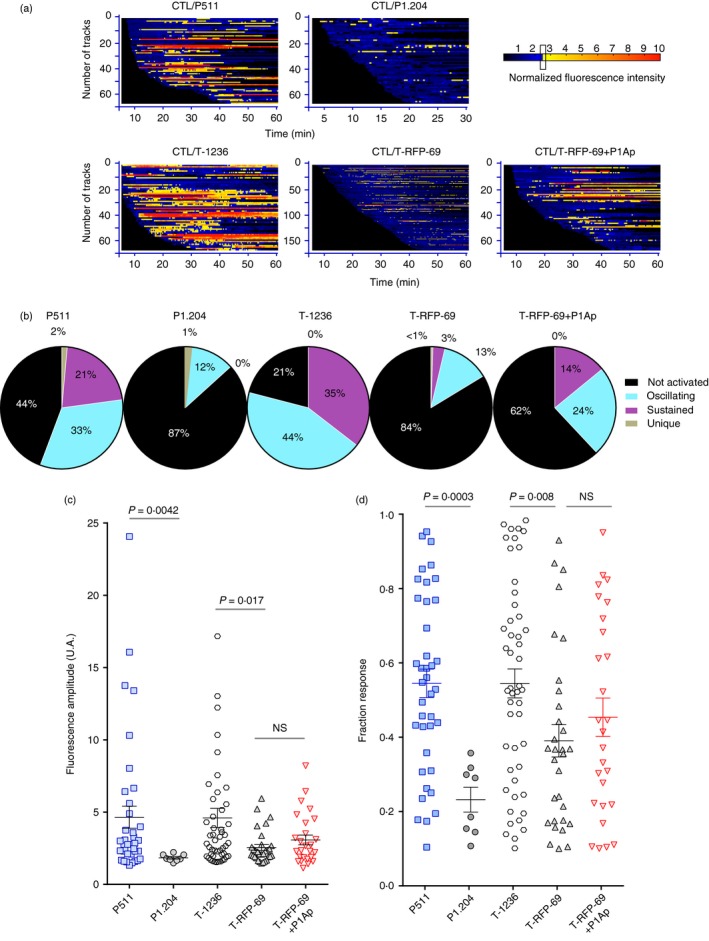
Figure 5.

Barcoding the TCRP1A‐GZMB‐Tom CTL Ca2+ fluxes in response to the different tumour cells. The videos corresponding to the CTL responses to tumour cells shown in Fig. 4 were analysed for Fluo‐4‐positive cell tracking with the MAAACS software described by Salles et al.26. The raw fluorescence recordings were normalized to the median of Fluo‐4 fluorescence values for each individual CTL. (a) Normalized Fluo‐4 intensity is displayed for individual cells as a barcoded response over time (colour‐code is function of the fluorescence amplitude (FA) threshold set to FA > 2·5) of the CTL in response to the indicated tumour cells. (b) The pattern of the Ca2+ response of the CTL towards each of the indicated tumour cells is represented in pie charts (non‐activated: black, oscillating: blue, sustained: purple, unique: grey) (see Materials and methods for classification of criteria). (c, d) Statistical representation of the fluorescence signal amplitude (c) and of the proportion of Ca2+ signal above the threshold for each cell per unit time (response fraction) (d). Mean ± SEM is shown. Statistical analysis was carried out with the Mann–Whitney non‐parametric test.
