Figure 3.

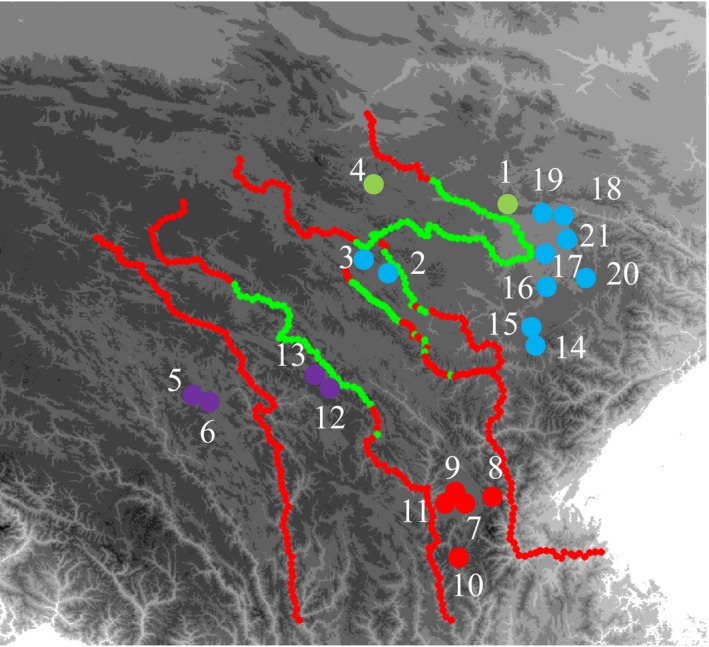
Results of population grouping based on mtDNA data and habitat suitability mapping of rivers. Red, Group S; purple, Group W; green, Group N2; blue, Group N1. Red dash lines indicate unsuitable habitats and green indicates suitable habitats

Results of population grouping based on mtDNA data and habitat suitability mapping of rivers. Red, Group S; purple, Group W; green, Group N2; blue, Group N1. Red dash lines indicate unsuitable habitats and green indicates suitable habitats