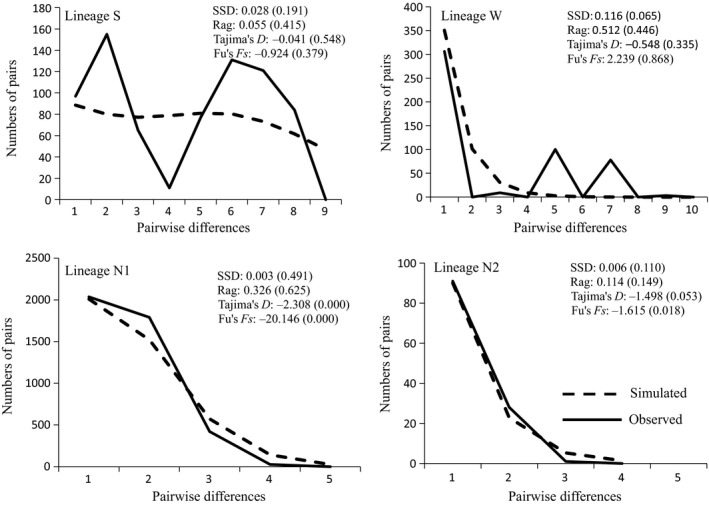
Figure 5.

Results of mismatch distribution and neutrality test. Solid lines denote the observed mismatch distributions, and dash lines indicate simulated mismatch distributions. X‐axis stands for pairwise differences and y‐axis stands for numbers of pairs. The goodness of fit of the observed vs. the theoretical mismatch distributions under a sudden expansion model was tested using the sum of squared deviation and raggedness (Rag) index. Values in brackets indicated p values
