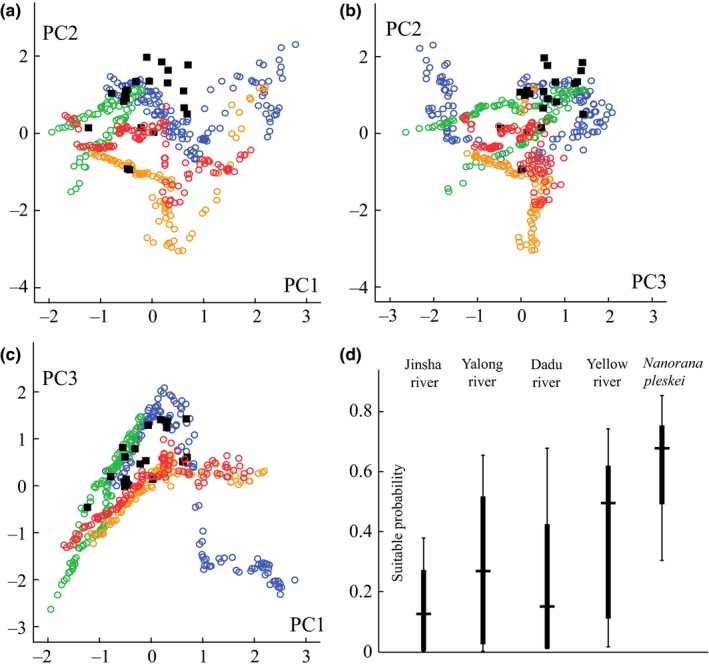
Figure 7.

(a–c) Scatter plots of principal components. Black solid squares indicate sampling localities of Nanorana pleskei. Empty circles indicate rivers. Purple indicates Dadu River, green indicates Yellow River, orange indicates Jinsha River, and red indicates Yalong River. (d) Overlapping of suitable probability between N. pleskei and rivers visualized by box plots
