
Figure 2. Crystal structures of ELIC showing 2-bromoethanol (BrEtOH) binding sites.
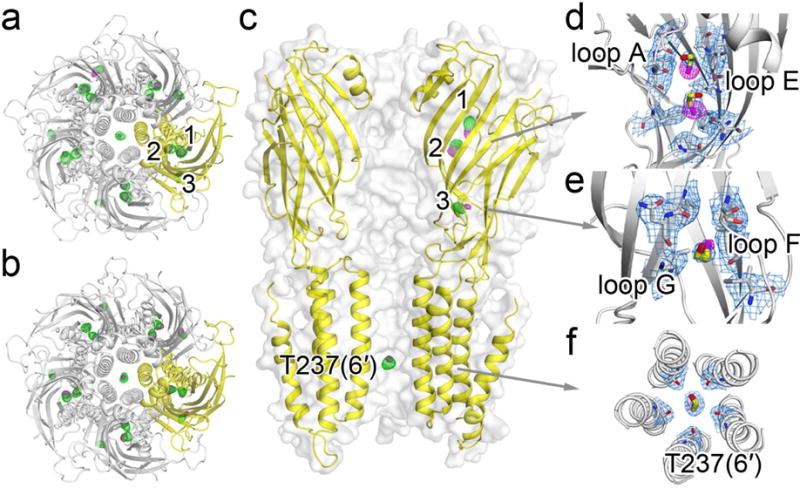
Top views of BrEtOH binding to ELIC in (a) the resting and (b) desensitized states. (c) Side view of BrEtOH binding to ELIC in the desensitized state. The FO-FC omitted electron density maps (green) are contoured at 3.0 σ. The anomalous difference electron maps (magenta) are contoured at (a) 4.0 σ and (b) 5.0 σ for the resting and desensitized ELIC, respectively. (d)–(f) 2FO-FC electron density maps (light blue, contoured at 1.0 σ) of ELIC in a desensitized state showing: (d) two BrEtOH molecules bound to a pocket in the ECD lined by loop A and loop E; (e) the third BrEtOH in the ECD bound to a pocket between loop G and loop F; and (f) a bottom view of BrEtOH bound to the pore near T237(6′). Residues within 4 Å of BrEtOH molecules are shown as sticks. The maps from (a) to (f) all have a carve distance of 2.0 Å from BrEtOH molecules.