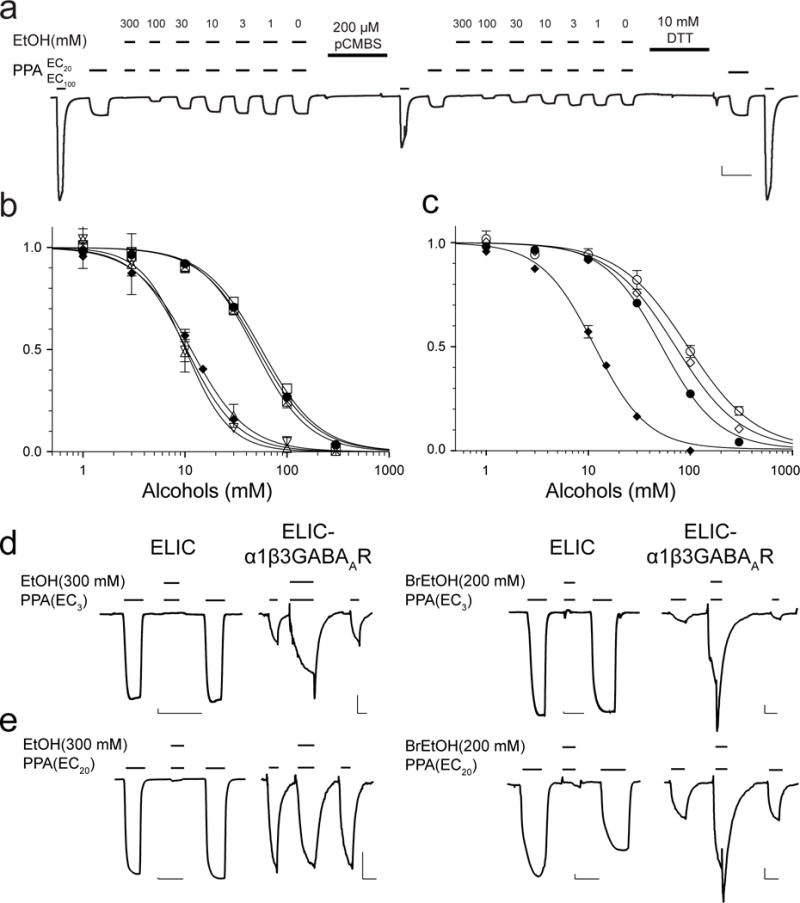
Figure 4. Alcohol binding to the pore determines functional inhibition of ELIC.

(a) A representative trace of ethanol (EtOH) inhibition of the I23C/Y102F ELIC mutant, showing that labeling 4-chloromercuribenzenesulfonic acid (pCMBS) to I23C in the ECD binding pocket reduced the agonist-elicited current, but did not change EtOH modulation as quantified in (b). 10 mM DTT recovered the normal response to agonist activation by removing the pCMBS labeling. The vertical and horizontal scale bar represents 1 μA and 60 s, respectively. (b) Neither the ECD mutations nor pCMBS labeling affects the inhibition of ELIC by EtOH and 2-bromoethanol (BrEtOH). EtOH inhibition of ELIC (•, IC50 = 52.1 ± 1.5 mM), I23C/Y102F in the absence of pCMBS labeling (☒, IC50 = 48.6 ± 2.0 mM), and in the presence of pCMBS labeling (▪, IC50 = 56.2 ± 2.5 mM); BrEtOH inhibition of ELIC (◆, IC50 = 11.5 ± 0.4 mM), I23C/Y102F in the absence of pCMBS labeling (▽, IC50 = 10.1 ± 0.8 mM), and in the presence of pCMBS labeling (△, IC50 = 10.4 ± 2.0 mM). (c) The TMD T237(6′)A mutation alters the channel response to both EtOH and BrEtOH. EtOH inhibition of ELIC (•) and T237(6′)A (○, IC50 = 93.4 ± 6.0 mM), BrEtOH inhibition of ELIC (◆) and the T237(6′)A (◇, IC50 = 70.9 ± 3.6 mM). The data were normalized to the current at EC20 in the absence of EtOH or BrEtOH and fit to the Hill equation (solid lines, n ≥ 6). (d) Representative traces obtained at a low agonist concentration (EC3) showing EtOH (left traces) or BrEtOH (right traces) inhibition of ELIC and potentiation of ELIC-α1β3GABAAR. (e) At EC20, EtOH (left traces) or BrEtOH (right traces) strongly inhibit ELIC. EtOH shows no inhibition of ELIC-α1β3GABAAR, while BrEtOH still shows some potentiation. The vertical and horizontal scale bars in (d, e) represent 30 nA and 60 s, respectively.
