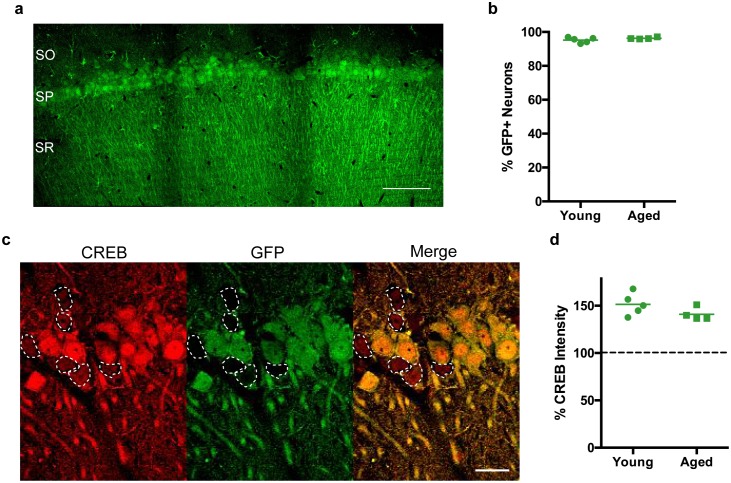
Figure 1. CREB expression levels are increased in CA1 neurons of both young and aged rats following stereotaxic injection of AAV-CREB vector into dorsal CA1 region.
(a) The AAV-CREB vector contained a GFP reporter. Example of a stitched 40x confocal image of GFP staining in CA1 area. SO – stratum oriens; SP – stratum pyramidale; SR – stratum radiatum. Scale bar = 100 μm. (b) The percentage of infected CA1 neurons in young and aged animals (n = 5, 4) was quantified by dividing the number of GFP positive cells by the total number of NeuN positive cells for each animal. (c) Example of CREB immunofluorescence in infected (green) and uninfected (not green, outlined) cells. Note the higher intensity in GFP positive cells. Scale bar = 20 μm. (d) AAV-CREB infected cells (i.e., GFP positive cells) had higher CREB expression than uninfected cells. Relative CREB expression level of infected cells was quantified as a percentage of CREB intensity of uninfected cells (normalized to be 100%, dashed line) in young and aged animals (n = 5, 4).


