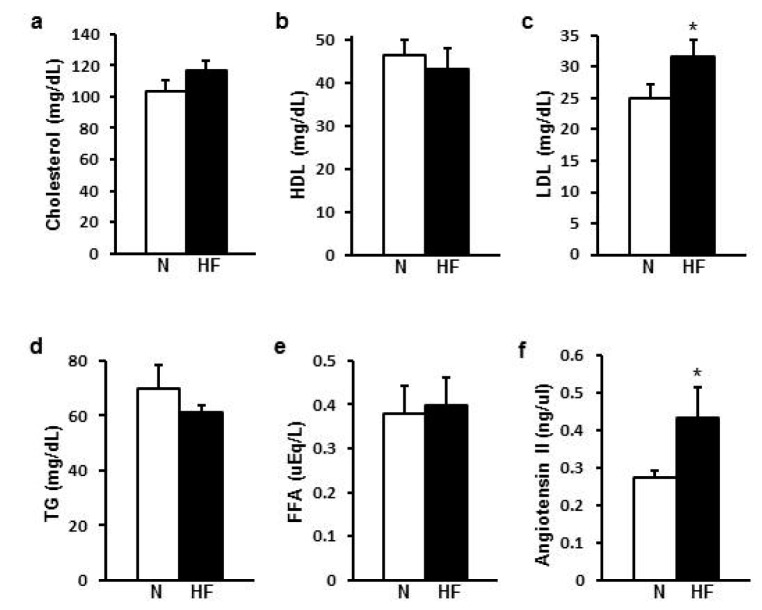
Fig. 3. Lipids and Angiotensin II (Ang II) in the plasma of normal or HFD-fed rats.
The graph summarized total cholesterol (a), high density lipoprotein (HDL) (b), low density lipoprotein (LDL) (c), triglyceride (d), free fatty acid (e), and Ang II (f ) in the plasma of normal diet (ND) or HFD-fed rats. Plasma LDL and Ang II were higher in HFD group than ND group. Data are presented as means±SE (n=4). *p<0.05 vs. ND group. N, normal; HF, high fat.

