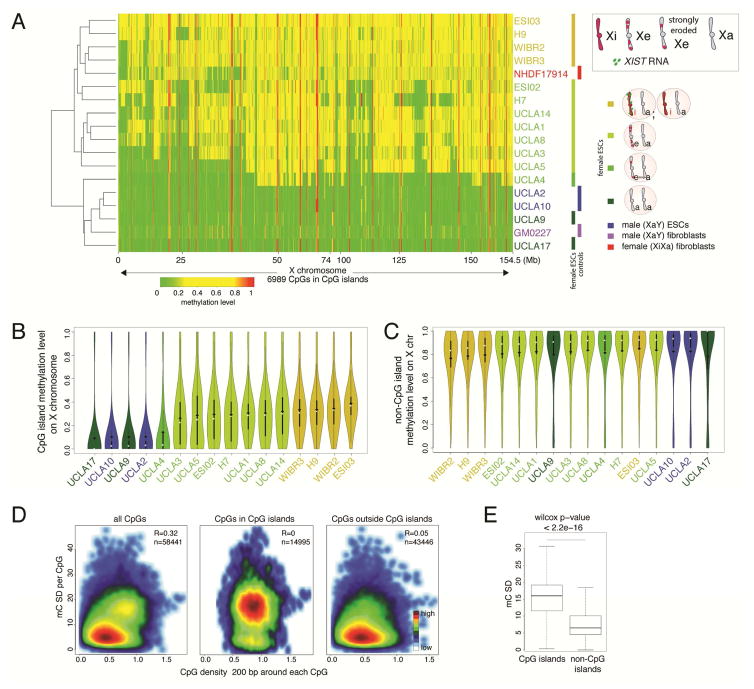
Figure 2. CGI methylation distinguishes XeXa, XaXa, and XiXa ESCs.
A) Heatmap of unsupervised hierarchical clustering of RRBS-based methylation levels for CpGs within X-linked CGIs in indicated female and male ESC lines and control fibroblasts. Methylation level of 1 indicates 100% methylation and 0 absence of methylation. CpGs with constitutively low (<0.15) and high (>0.85) methylation were excluded to highlight Xi-linked intermediate methylation.
B) Violin plots of the distribution of methylation levels of CpGs in X-linked CGIs in indicated cell lines. White square=median, black diamond=mean.
C) As in (B), except for methylation levels of X-linked CpGs outside CGIs.
D) Plot of standard deviation (SD) of methylation of all X-linked CpGs and the subsets within and outside of CGIs, respectively, relative to CpG density in the 200-nucleotide window around each CpG considered, in female ESC lines with different XCI states. The number of CpGs analyzed is given.
E) Boxplot of SD values defined in (D) for X-linked CpGs within and outside of CGIs and significance testing of the difference.
See also Figure S4.

