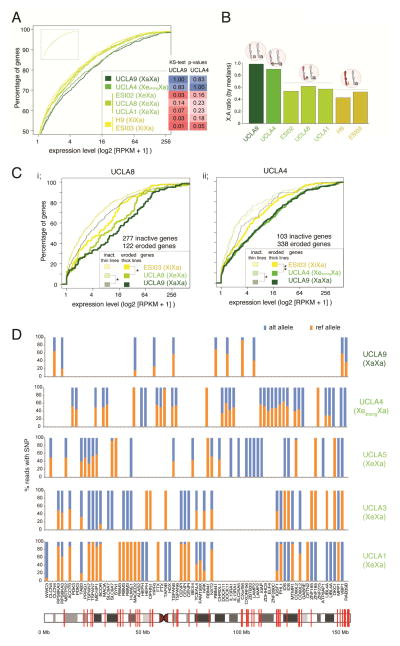
Figure 3. X-linked gene expression is higher in XeXa and XaXa than XiXa ESCs.
A) Cumulative distribution functions (CDFs) of X-linked gene expression for indicated female ESC lines based on RNA-seq data. Inset gives the CDFs of autosomal gene expression for the same cell lines (same XY-scales). ks-test p-values are given for the comparison of X-linked gene expression distributions between the XaXa line UCLA9 and the strongly eroded XeXa line UCLA4, respectively, and all other lines.
B) X-to-autosome (X:A) ratio of median gene expression in indicated female ESC lines based on RNA-seq data.
C) (i) CDFs of expression values of eroded (thick lines) and inactive (thin lines) genes on the X in the XeXa line UCLA8 defined based on the methylation level of promoter-associated CGIs. The expression of the same two gene sets in the XaXa line UCLA9 and the XiXa line ESI03 was also plotted for comparison. *=ks-test p-value ≤ 0.05 in comparisons of eroded and inactive genes between UCLA8 and the two ESC lines. (ii) As in (i) except for inactive and eroded X-linked genes for the strongly eroded line UCLA4. **=p-value < 0.005.
D) Allelic expression analysis based on RNA-seq reads. X-axis lists genes subject to XCI with informative SNPs covered by five or more RNA-seq reads in the indicated female ESC lines, and the Y-axis the proportion of reads originating from the reference (ref) or alternate (alt) allele. If more than one such SNP was present in the same gene, the gene appears more than once. If the given SNP was not informative or did not have ≥5 reads in a given ESC line, it appears as a blank on the graph. Red lines show SNP locations in the X-chromosome image.

