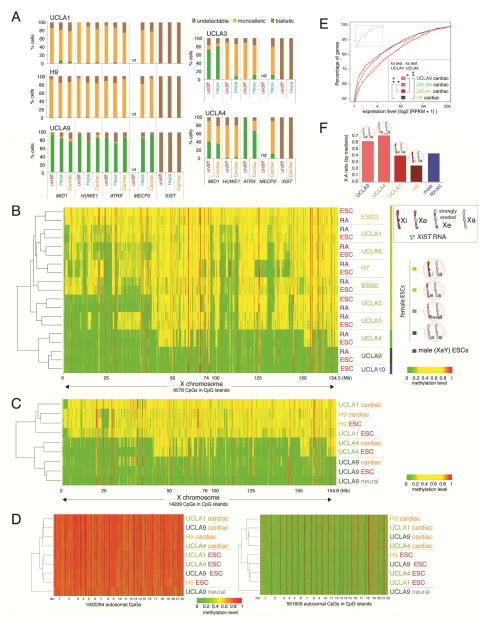
Figure 4. The XCI state of ESCs is maintained in differentiated cells.
A) Quantification of X-linked gene RNA FISH pattern and XIST in ESC lines and ESC-derived cardiomyocytes and hepatocytes.
B) Heatmap of unsupervised hierarchical clustering of RRBS-based methylation levels for CpGs within X-linked CGIs in indicated female and male ESC lines and their day 10 RA-induced differentiation products. CpGs with constitutive low (<0.15) and high (>0.85) methylation levels were not included to highlight the intermediate methylation due to XCI.
C) As in (B), except for indicated female ESC lines in the undifferentiated state and upon directed differentiation into neurons and cardiomyocytes.
D) Heatmap of unsupervised hierarchical clustering of RRBS-based methylation levels for all autosomal CpGs (left) and only those within CGIs (right) for the same cell lines/conditions shown in (C). The numbers below indicate chromosomes, which are separated by dashed lines.
E) CDFs of X-linked gene expression for ESC-derived cardiomyocytes. Inset shows normalized autosomal expression data for the same cell lines at the same XY-scales. p-values of the ks-test for the difference of expression distributions between UCLA9 and UCLA4, respectively, and all other lines are given (*≤0.05; **≤0.0005).
F) X:A ratio of median gene expression in cardiomyocytes derived from the indicated ESC lines based on RNA-seq.
See also Figures S3 and S5.

