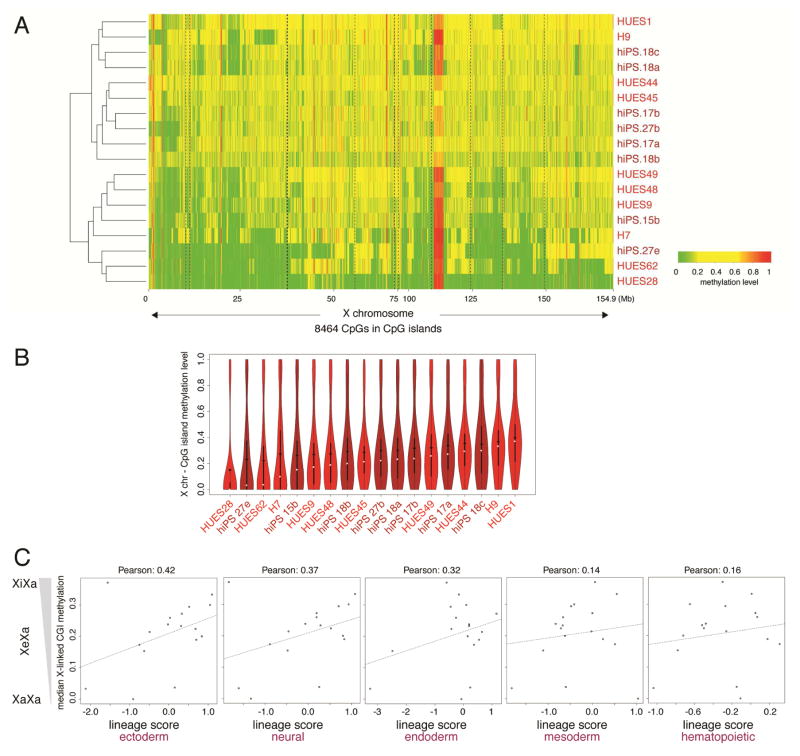
Figure 5. X-chromosome silencing correlates with differentiation propensity.
A) Heatmap of unsupervised hierarchical clustering of RRBS-based methylation levels for CpGs within X-linked CGIs in indicated female ESC (red) and iPSC (dark red) lines obtained from Bock et al (2011). CpGs with constitutive low (<0.2) and high (>0.6) methylation were not included to emphasize intermediate methylation due to XCI.
B) Violin plots of methylation levels of CpGs in X-linked CGIs for cell lines shown in (A). White square=median, black diamond=mean.
C) Scatterplot of the median methylation level of X-linked CGIs for each cell lines shown in (A) (low median methylation indicates presence of an Xa or strongly eroded Xe and high methylation indicates an Xi or weakly eroded Xe) versus the lineage scores for differentiation propensity for the same line.
See also Figure S6.

