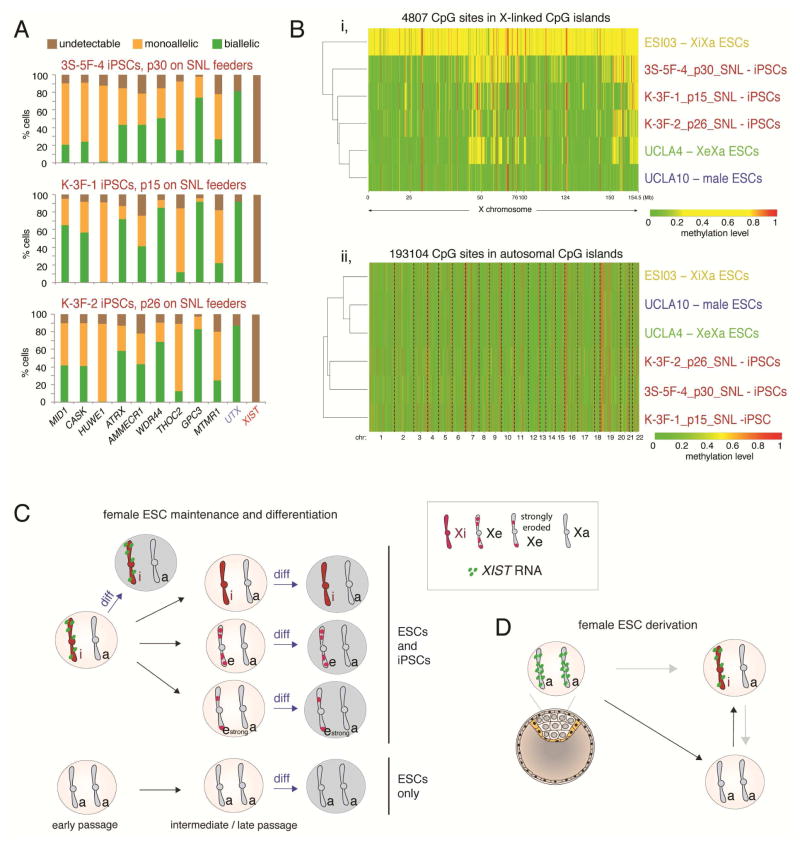
Figure 7. Summary of XCI states observed during derivation, propagation and upon differentiation of ESCs, and comparison to iPSCs.
A) Quantification of the RNA FISH pattern of indicated X-linked genes normally subject to XCI, of the X-linked gene UTX that escapes XCI, and of XIST in three SNL-converted iPSC lines (Tomoda et al., 2012).
B) (i) Heatmap of unsupervised hierarchical clustering of RRBS-based methylation levels for CpGs within X-linked CGIs in female iPSCs described in (A), and indicated ESC lines for comparison. Only CpGs that are not constitutively lowly (<0.15) and highly (>0.85) methylated were plotted to better capture the intermediate methylation due to XCI. (ii) As in (i), expect that CpGs in autosomal CGIs were analyzed, revealing clustering by culture condition.
C) Scheme summarizing changes in XCI-state during ESC propagation and differentiation.
D) As in (C), but during ESC derivation.
See also Figure S7.

