
Fig. 3.
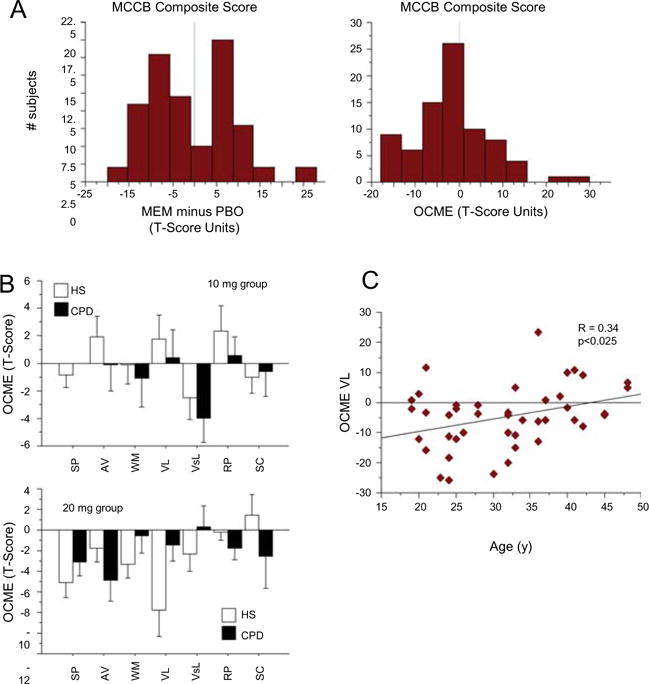
Correcting MEM effects to account for impact of test order via an “order-corrected MEM effect” (OCME) variable. OCME was calculated from each subject’s T-score “MEM effect” (i.e., MEM minus PBO), and adjusting for the group mean order effect (day 2 minus day 1) for that domain or composite value. a Left histogram shows bimodal distribution of MEM effects on MCCB scores (MEM minus PBO, composite T-scores in this example) reflecting populations distinguished by those who received MEM on test day 1 vs. 2; right histogram shows unimodal distribution of OCME scores. b OCME scores for 10 mg group (top) and 20 mg group (bottom), showing mixed neurocognitive effects of 10 mg MEM across MCCB domains, and largely neurocognitive-impairing effects of 20 mg MEM, particularly across domains of SP, AV, WM, and VL. The high dose of MEM impaired VL to a greater degree in HS than in CPD subjects, an effect that cannot be easily parsed from the age sensitivity of this MEM effect (c), due to the older age of CPD vs. HS subjects in this 20 mg dose group