
Figure 1.
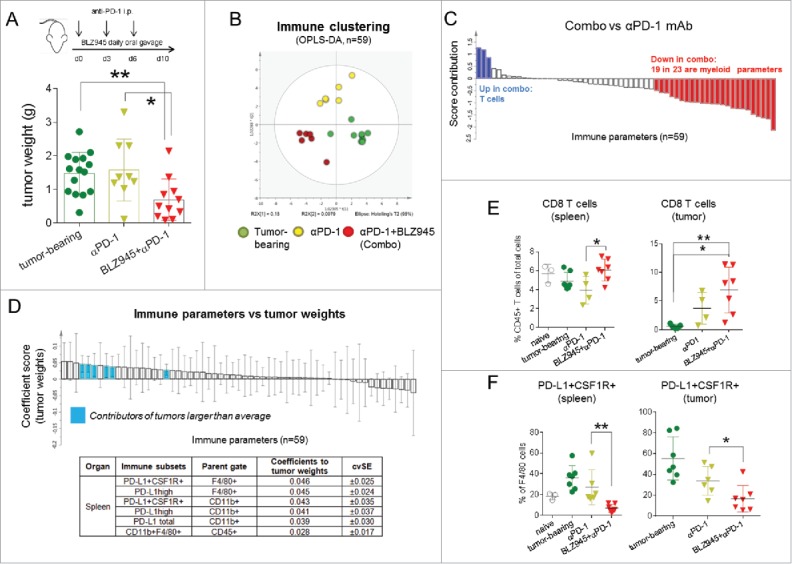
Expansion of T cells and reduction of suppressive myeloid cells results in antitumor activity. From the day spontaneous tumors were detected, TH-MYCN mice were treated by daily oral gavage of BLZ945 for 10 d combined with i.p. injections of anti-PD-1 antibody (12.5 mg/kg) on days 0, 3, and 6. Control mice were treated with anti-PD-1 antibody or left untreated. (A) Tumors were excised and tumor weights were compared among groups on day 10. Immune subsets and activation status of myeloid cells and lymphocytes were measured by flow cytometry in the spleens and tumors of control or treated mice (n = 59). (B) The clustering of the immune parameters was modeled and analyzed by multivariate analysis (OPLS-DA) using the SIMCA platform. (C) A direct comparison of the immune profile between combination treatment group and anti-PD-1 treated animals was demonstrated. (D) Next, tumor weights were set as Y variables and correlated with X variables (immune parameters, n = 59) using OPLS analysis. Immune parameters contributing to tumor burdens were highlighted in blue based on the coefficient scores and cvSE values. To validate the analysis, (E) frequencies of CD8 T cells and (F) PD-L1+CFS-1R+ macrophages were compared among different groups. *p < 0.05; **p < 0.01; non-parametric Mann–Whitney U test. Each dot in the scatter-dot plots represented an individual mouse. OPLS: orthogonal partial least squares analysis; OPLS-DA: orthogonal partial least squares discriminant analysis; and cvSE: cross-validation standard errors.