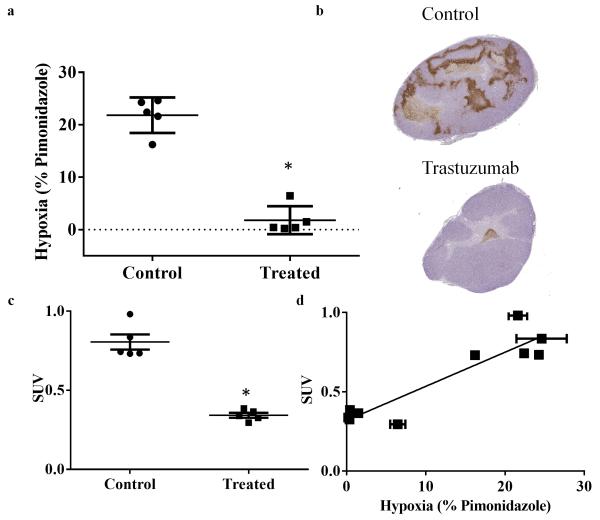
Fig 3.
Correlation of hypoxia imaging and histology is shown through central slice analysis of the treated and control tumors. a Graph revealing quantitative analysis of percent hypoxia staining from histology. Treated tumors reveal significantly decreased hypoxia compared to controls. b Representative histology central slices showing overall hypoxia (as stained with pimonidazole, brown) in the treated and control animals. c Day seven scatterplot of central slice SUV comparing treatment and controls. d Quantitative hypoxia imaging (SUV hotspot) and quantitative histology shows a positive linear correlation (r2 = 0.85, P < 0.001).

