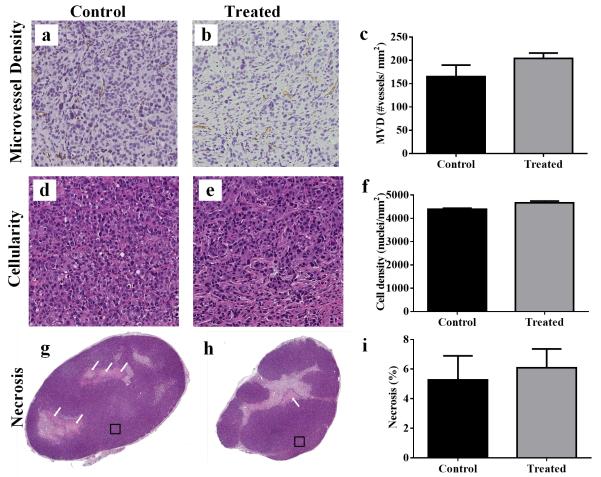
Fig 4.
Quantitative analysis comparing treated and control tumors and representative histology sections are shown for H&E and CD31. CD31 microvessel density (MVD) is shown for a control and b treated tumors; c quantitative analysis reveals no significant changes between the groups on day seven (P = 0.22). H&E cellularity is shown for d control and e treated tumors; f quantitative analysis reveals no significant difference in cellularity in treated tumors compared to controls on day seven (P = 0.22). H&E percent necrosis is shown for g control and h treated tumors; i quantitative analysis reveals no significant changes in necrosis in treated tumors compared to controls on day seven (P = 0.53). Squares in g and h demonstrate the representative regions displayed in tiles a,c and b,d, respectively.

