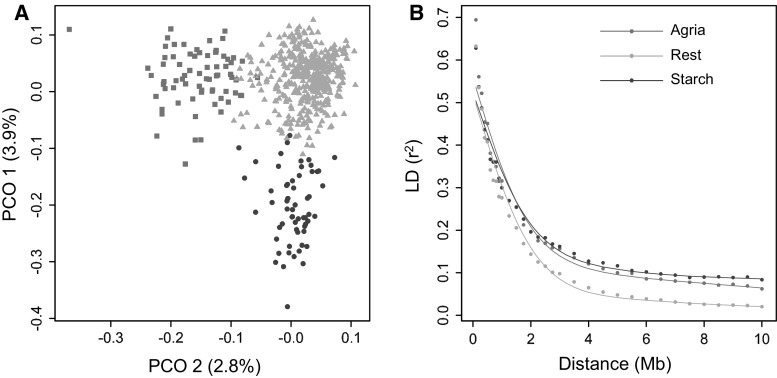
Fig. 3.
LD decay and population structure. a Principal coordinate analysis showing varieties based on >0.5 group membership probability obtained by STRUCTURE. Green triangles represent the conventional varieties. Blue circles represent modern varieties bred for starch industry. Red squares represent modern processing varieties related to Agria. b 90 % percentiles show LD decay within subgroups of varieties. Colour codes are indicated in the graph (colour figure online)

