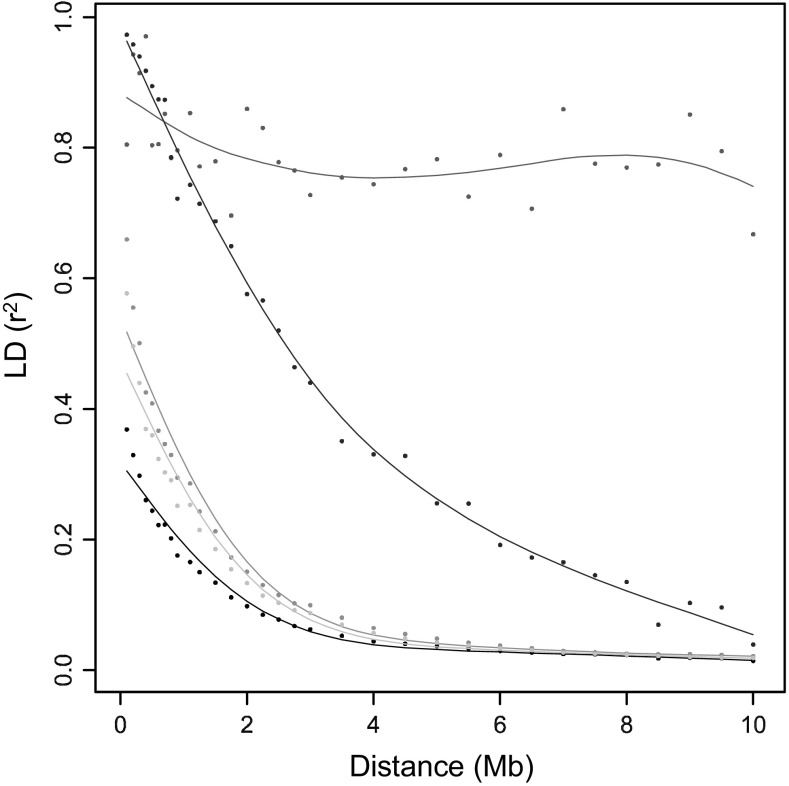
Fig. 4.
LD decay perceived with different subsets of SNPs. The blue curve represents the LD decay between SNPs on haploblocks introgressed since 1945. The red, turquoise, and black curves represent LD decay between subsets of SNPs with different MAF thresholds. Red = MAF > 10 %. Turquoise is MAF > 2.5 %. Black is MAF > 1 %. The green curve represents LD decay between SNPs with physical coordinates located in the pericentromeric heterochromatin (colour figure online)

