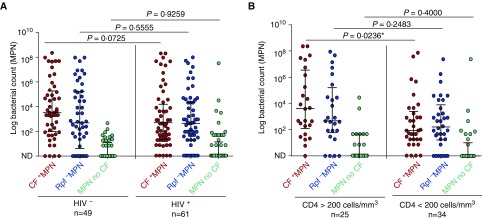
Figure 3.
Measures of bacterial load stratified by HIV-1 infection status or CD4 T-cell counts. (A) Scatterplot depicting bacterial load distributions in HIV infected/uninfected individuals. (B) Scatterplot depicting bacterial load distributions in individuals with high versus low CD4 T-cell counts. Error bars represent medians and interquartile ranges. To determine statistical significance, the Mann–Whitney U test was used with a 95% confidence interval. CF+ MPN (red), Rpf− MPN (blue), MPN no CF (green). Two participants had missing CD4 counts. In all categories the CF+ MPN/Rpf− MPN yielded higher bacterial counts when compared with the MPN no CF (P < 0.0001). *Significant with a 95% confidence interval. CF = culture filtrate; MPN = most probable number; ND = no bacterial growth detected; Rpf = resuscitation-promoting factors.

