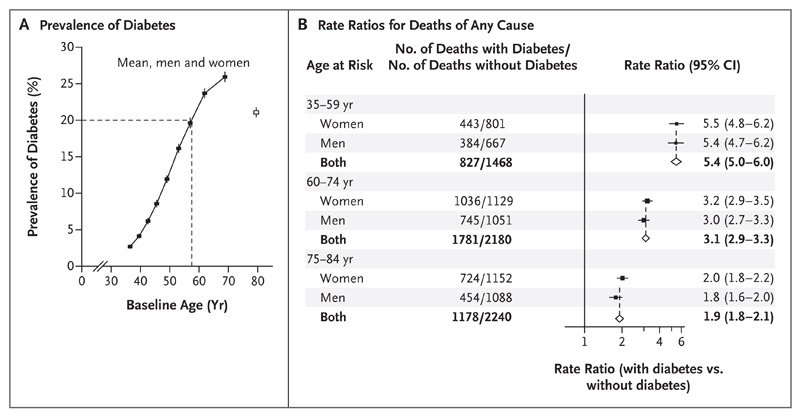
Figure 1. Prevalence of Previously Diagnosed Diabetes and Its Relevance to Rates of Death from Any Cause during 12-Year Follow-up.
Panel A shows the prevalence of previously diagnosed diabetes among all study participants. I bars represent 95% confidence intervals. The dashed lines indicate the age at which the prevalence of diabetes was 20%. Panel B shows the rate ratios for death from any cause among participants with and participants without previously diagnosed diabetes at recruitment. The rate ratios for death exclude data from any participants who had previously diagnosed chronic disease other than diabetes (chronic kidney disease, ischemic heart disease, stroke, cirrhosis, cancer, or emphysema) and are adjusted for standard features (age, smoking status, district, educational level, height, weight, and waist and hip circumferences). The size of each square is proportional to the amount of data available, and unshaded diamonds represent the values for men and women combined. Horizontal lines represent 95% confidence intervals.

