
Fig. 2.
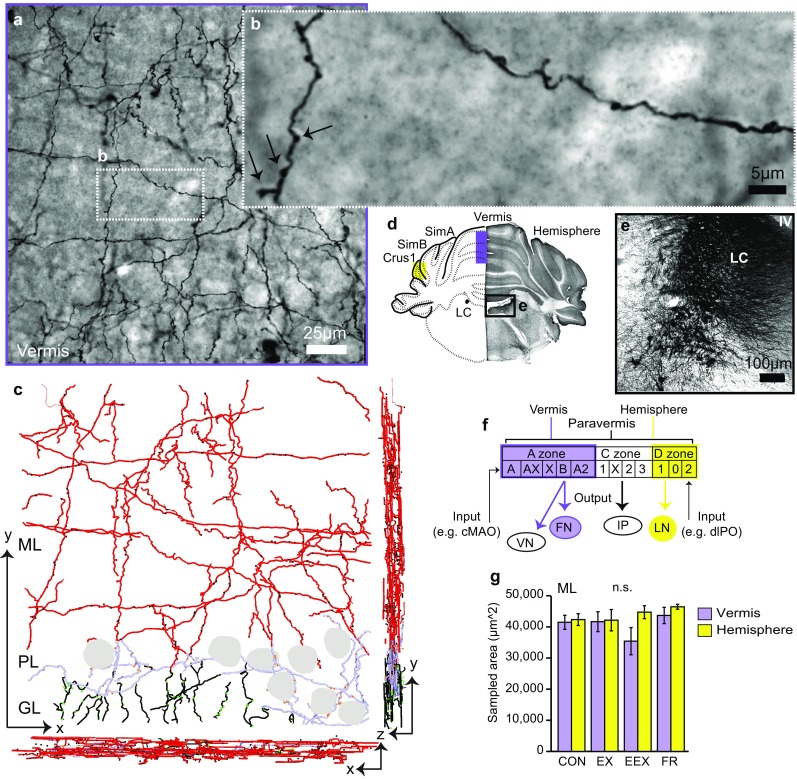
Confocal style stack and systematic 3D reconstruction of NA fibers. a Coronal view of the vermis NA axonal plexus in the ML, PL, and GL, revealed by immunohistochemical labeling, using anti-DβH antibodies, and visualized with DAB. b Enlarged inset from a demonstrates swollen varicosities (black arrows) along NA fibers. c Neurolucida-reconstructed NA axons from the image stack in (A) viewed in the x, y plane, and orthogonal x, z and y, z planes after correcting for shrinkage in the z plane. Small filled circles are markers representing the NA varicosity location in three-dimensional space. Note that the marker size does not reflect actual biological varicosity sizes. Gray contours depict locations of Purkinje cell bodies. d Low magnification (10×) tiled image stained for DβH and schematic of the coronal slice showing the sampled vermis (purple fill) and hemisphere (green fill) regions. e Darkly stained LC NA neurons demonstrating the specificity of the DβH antibody. f The rationale for investigating the vermis and hemisphere regions depicting distinct output and input connectivity to the vermis (A zone) and hemisphere (D zone), based on previous works (Apps and Hawkes 2009; Sillitoe et al. 2009; Sugihara and Shinoda 2004; Voogd and Ruigrok 2004). The boxes below each zone are further subdivisions with specific input and output connectivity (example shown by input/output arrows). g Summary plot showing consistently sampled areas across groups, N = 8 rats per group except N = 7 for the hemisphere of EEX and FR groups. Error bars are SEM, n.s. (not significant; one-way ANOVA P > 0.05). DβH dopamine β-hydroxylase, DAB 3-3′ diaminobenzidine, cMAO subnucleus b, dlPO dorsal lamella of the principal olive, ML molecular layer, PL Purkinje cell layer, GL granule cell layer, LC locus coeruleus