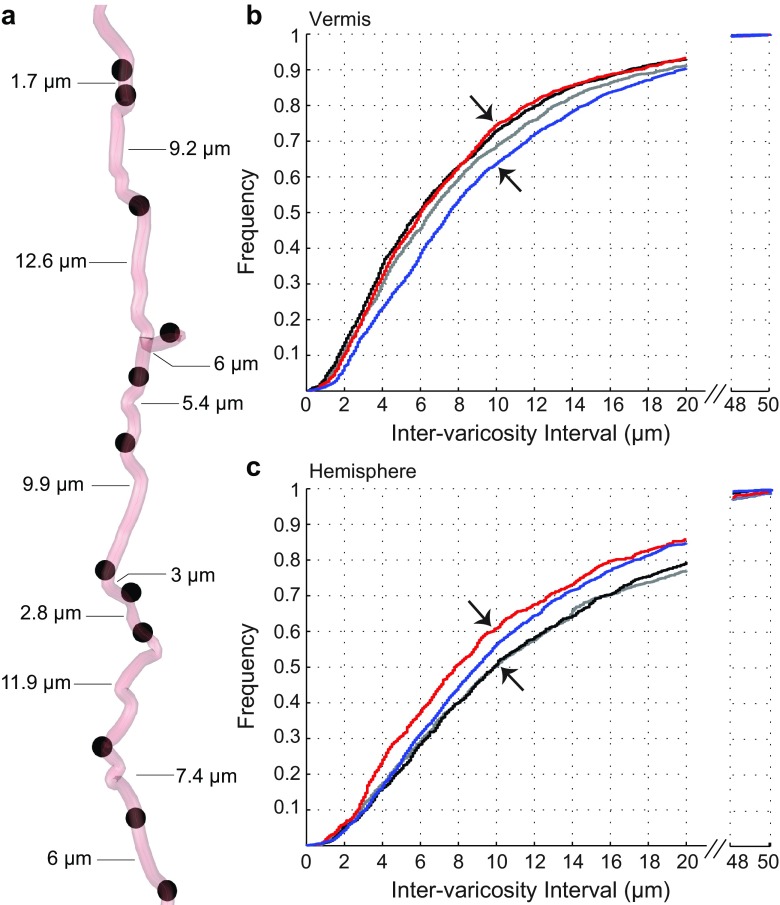
Fig. 3.
Inter-varicosity intervals along NA fibers following running activity. a An example of a NA axon fiber with 12 varicosities, separated by different axonal lengths, measured with Neurolucida Explorer. b, c Graphical representation of the normalized cumulative frequency distributions of inter-varicosity intervals for the vermis and the hemisphere’s NA axons of EX (black), EEX (red), FR (blue) rats, relative to controls (CON, gray)

