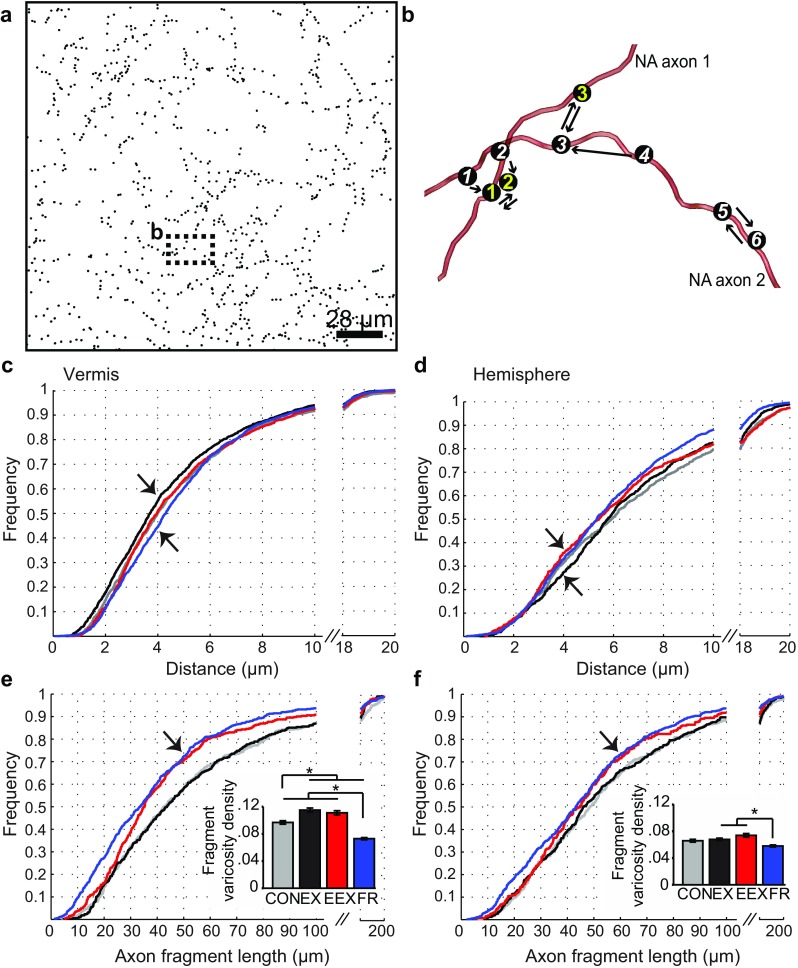
Fig. 4.

The nearest neighboring varicosity distance (NNVD) of NA varicosities of the three experimental groups. a Demonstration of the NA varicosities’ spatial organization, independent of their axon fibers, emphasizing the global release of NE. b Scheme showing the method of determining the NNVD among the NA varicosity population. Each arrow indicates the nearest varicosity from each originating varicosity. Note that the nearest neighboring varicosities are not always reciprocal. For example, even though varicosity 3 on axon 2 is closest to varicosity 4 on axon 2 (single arrow), the nearest neighbor of varicosity 3 on axon 2 is not varicosity 4 on axon 2 but is varicosity 3 on axon 1. The double arrows between varicosity 3 on axon 1 and varicosity 3 on axon 2 are examples whereby the two varicosities are reciprocally closest to each other. c, d Graphical representation of the cumulative frequency distributions of NNVDs for the vermis and the hemisphere NA axons of EX (black), EEX (red), FR (blue) rats relative to controls (CON, gray). Insets show summary plots of the distribution values. e, f Averaged cumulative frequency curve for NA fragment lengths in the vermis and the hemisphere
