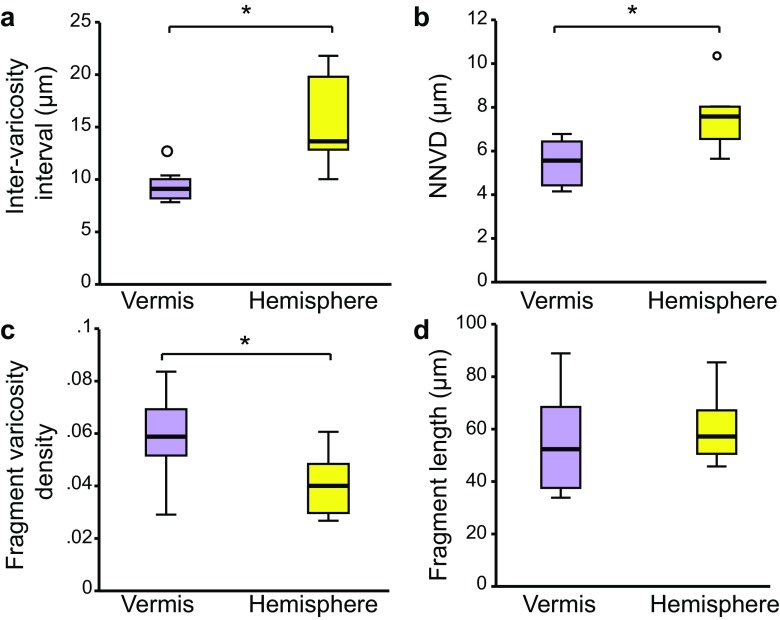
Fig. 5.
NA innervation of the vermis and the hemisphere at basal state. a Inter-varicosity interval, b NNVDs, c fragment varicosity density and d average fragment length compared between vermis and hemisphere in sedentary CON rats. The boxes depict the minimum and maximum sample range (whiskers), interquartile range (box) and median (horizontal bar). Asterisks depict statistical significance P < 0.05, t test; small circles depict outliers that were included in the statistical tests

