
Fig. 6.
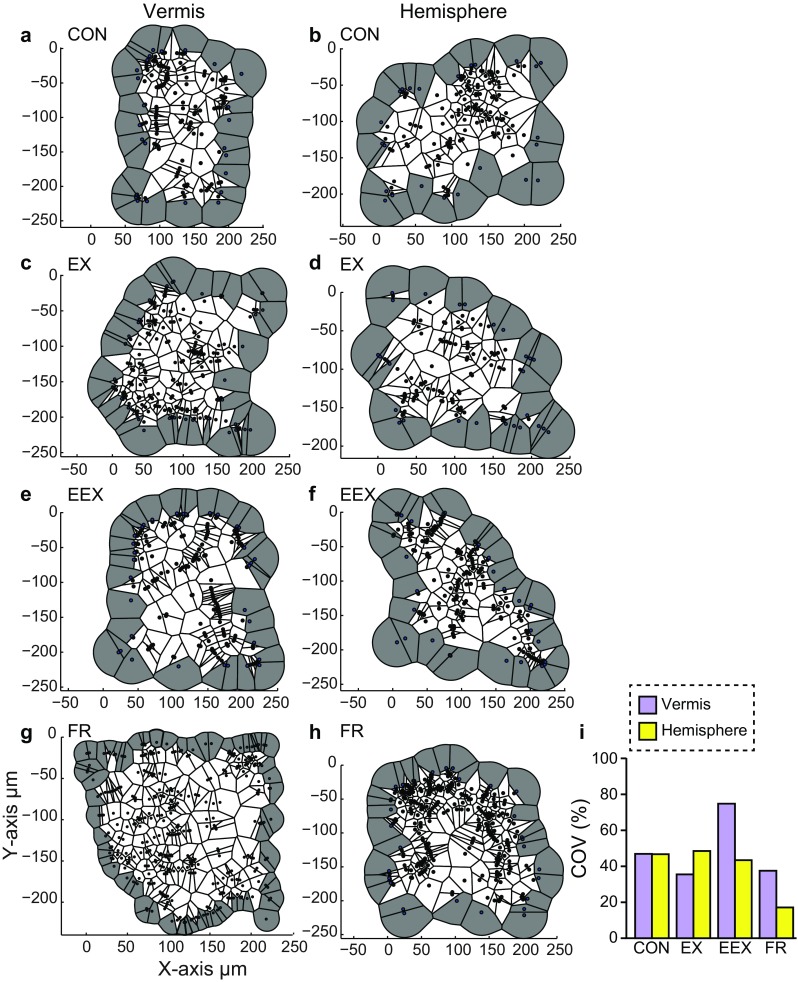
The Voronoi tessellation which measures the spatial distribution of varicosities, demonstrates that NA varicosity clusters are present in the cerebellum of CON rats, and that this clustering is altered following wheel running in an anatomically specific manner. a–f Examples of Voronoi polygons from regions of interest in the vermis and the hemisphere of CON, EX, EEX and FR rats. Gray zones indicate varicosities in the outer-most margins that were excluded from the calculation of averaged values of Voronoi polygons. Voronoi polygons are contiguous, filling the space around each NA varicosity without overlap, hence the term tessellation. Voronoi maps are shown in the X/Y plane and consist of all varicosities from the confocal stack collapsed onto a 2D plane. i Coefficient of variation (COV) reporting the percentage of varying Voronoi polygon areas, which indicates that the NA varicosity population is clustered, as a value of 0 % reflects no clustering in the population