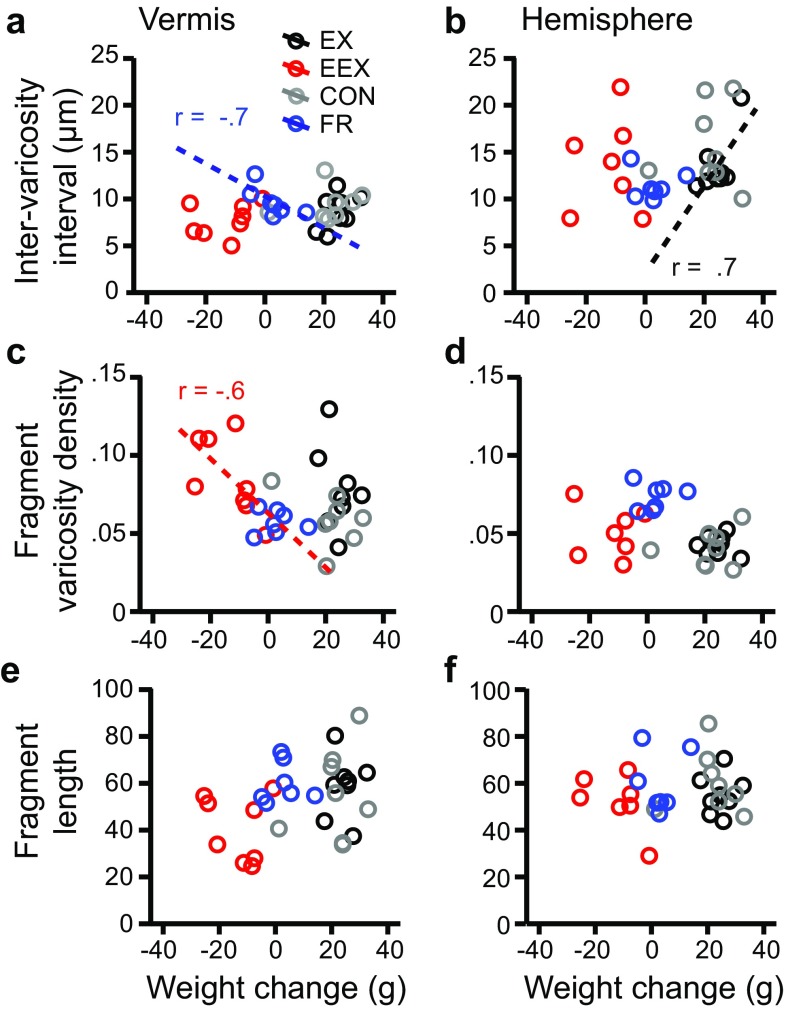
Fig. 8.
Correlations between weight change and NA plasticity. a, b Correlations between total weight change and the NA inter-varicosity intervals. c, d Correlations between total weight change and varicosity density along NA fibers. or e, f NA fragment length. Correlation coefficients are designated by r values. Asterisks indicate strong and statistically significant correlations (P < 0.05). Dotted trend lines indicate moderate correlations (r = ±0.6 or greater). N = 8 rats per group except N = 7 for the hemisphere of EEX and FR groups

