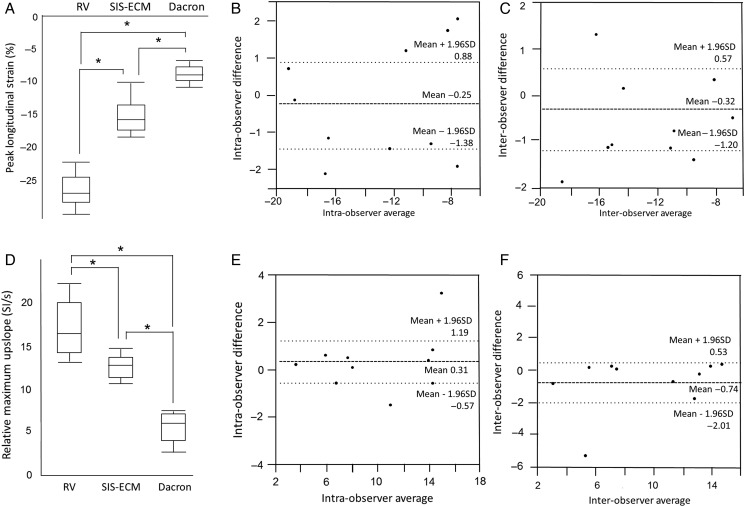
Figure 4:
Results of strain encoding and rest perfusion. (A) Peak longitudinal strain (strain encoding) and (D) relative maximum upslope (rest perfusion) of normal RV, SIS-ECM and Dacron patch is demonstrated. Bland–Altman plot for intraobserver for strain encoding (shown in B) and rest perfusion (shown in E), and interobserver for strain encoding (shown in C) and rest perfusion (shown in F) are shown. RV: right ventricle; SIS-ECM: extracellular matrix patch derived from small intestine submucosa.

