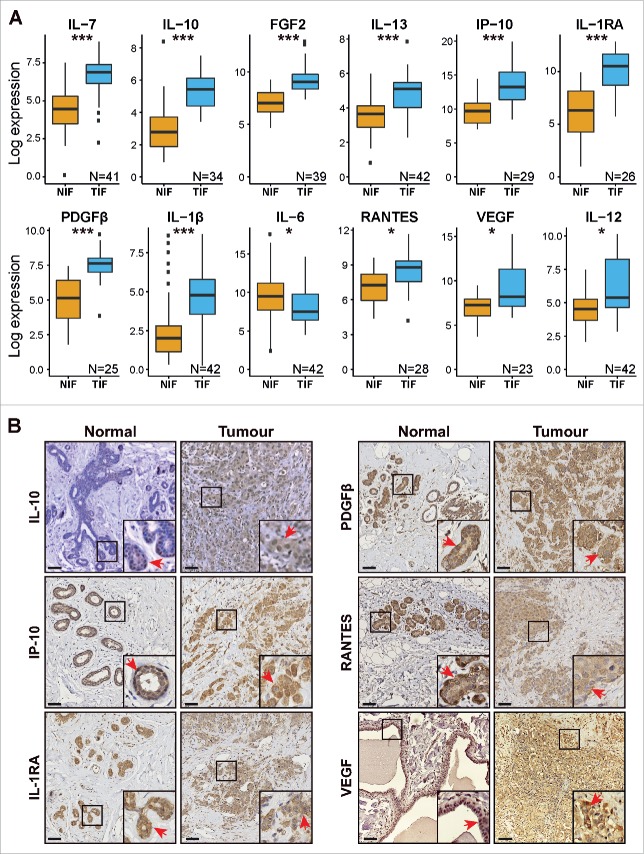
Figure 1.
Differential abundance of cytokines in TIF and NIF samples. (A) Cytokines differentially presented in NIF and TIF samples. Pairs of samples with at least one missing value were excluded from this analysis. Paired t-test, adjusted p-values: *p < 0.05; ***p < 0.001. (B) IHC images showing expression of IL-10, IP-10, IL-1RA, PDGFβ, RANTES, and VEGF in representative pairs of tissue sections corresponding to the same NIF and TIF pair. Red arrows show positive staining in ductal epithelial cells within normal and malignant lesions. Scale bar = 100 µm.

