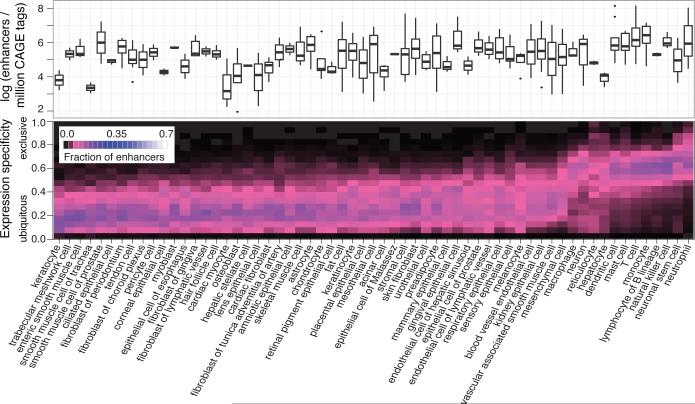
Figure 5. Enhancer usage and specificity in groups of cells.
The upper panel gives the number of detected enhancers per million CAGE tags within each group (facet) of related cell type libraries. The expression specificity of the enhancers is shown as a heat map in the panel below. Colors show the fraction of expressed enhancers in each facet (columns) that are in each specificity range (rows). For corresponding plots on organ/tissue facets and genes, see Supplementary Figure 21.

