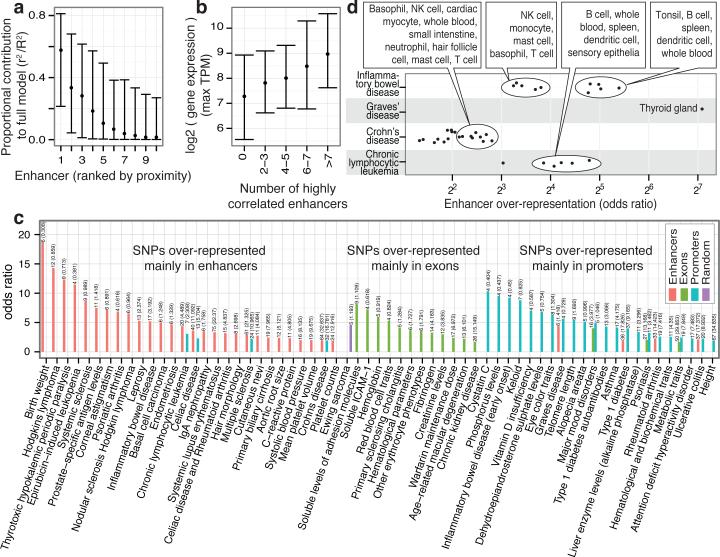
Figure 6. Linking enhancers to TSSs and disease-associated SNPs.
a, The proportional contribution (See Methods) of the 10 most proximal enhancers within 500kb of a TSS in a model explaining gene expression variance (vertical axis) as a function of enhancer expression. X axis indicates the position of the enhancer relative to the TSS: 1 the closest, etc. Bars indicate interquartile ranges and dots medians.
b, Relationship between the number of highly correlated (‘redundant’) enhancers per locus (horizontal axis) and the maximal expression (TPM) of the associated TSS in the same model over all CAGE libraries (vertical axis).
c, GWAS SNP sets preferentially overrepresented within enhancers, exons and mRNA promoters. The horizontal axis gives enrichment odds ratios. The vertical axis shows GWAS traits or diseases.
d, Diseases with GWAS associated SNPs over-represented in enhancers of certain expression facets. The horizontal axis gives the odds ratio as in panel C, broken up by expression facets: each point represents the odds ratio of GWAS SNP enrichment for a disease (vertical axis) in a specific expression facet. Summary annotations of point clouds are shown. Also see Supplementary Figure 31.

