
Fig. 3.
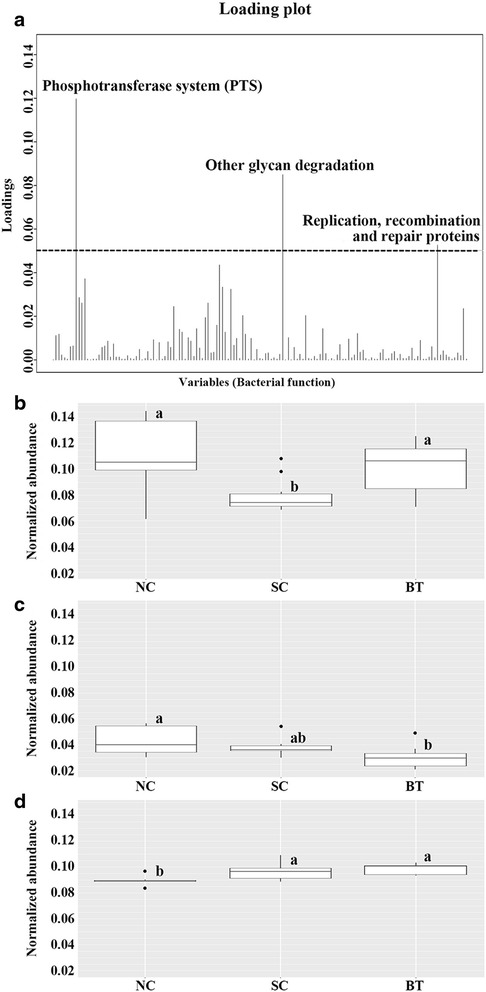
Functional analysis and comparison of microbial communities. a Canonical loading plot showing the magnitude of the influence of each variable on separation of individual peaks in the broiler microbiota (0.05 threshold level). Normalised abundances of functional activities b phosphotransferase system, c glycan degradation, and d recombination and repair proteins after Salmonella challenge. The interquartile ranges are indicated by the outer bounds of the boxes, the median by the midline (black), and the outliers are indicated by black circles (●). Tukey’s honestly significant difference (HSD) test was used to evaluate statistical significance (P < 0.05)