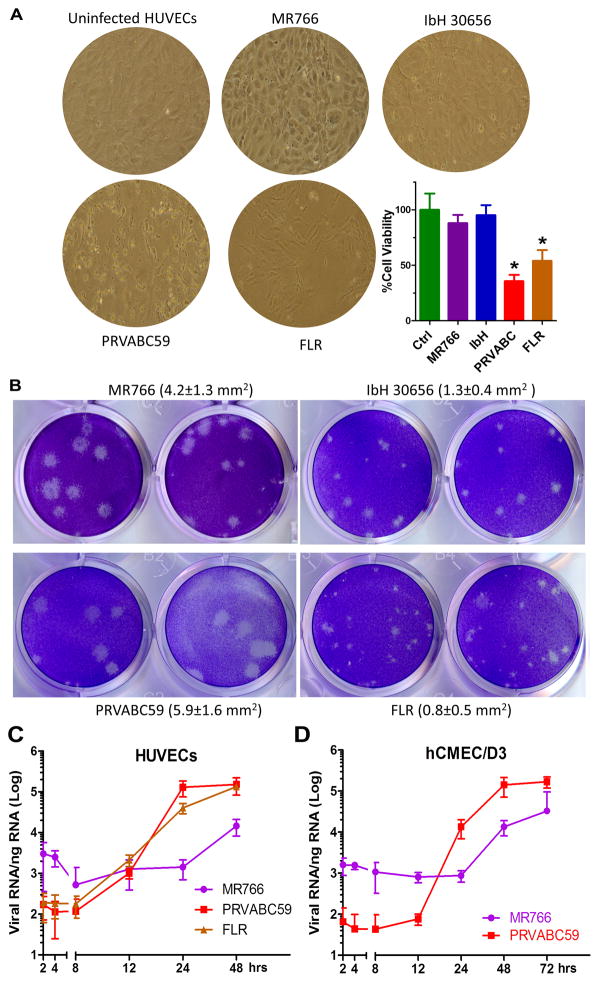
Figure 2. Enhanced virulence of South American ZIKV isolates.
(A) Representative phase-contrast images of infected HUVEC cells (ATCC, passage 2) from Fig. 1a at 48 hrs post-infection. The percentage of cell viability was quantified using the CellTiter-Glo Luminescent Cell Viability Assay (Promega). N = 3, *P<0.05. (B) Representative photographs of plaques using supernatants from above cells. Plaque sizes were indicated in the brackets. (C and D) HUVECs or hCMEC/D3 cells were infected by ZIKV MR766, PRVABC59 or FLR at MOI of 0.1 for 1hr. After extensive wash in PBS, cellular RNA was extracted at indicated time points post-infection for quantitative RT-PCR to determine the kinetics of virus RNA replication (n=4, each experiment contains 3 technical replicates; error bars, s.d.).

