
Fig. 4.
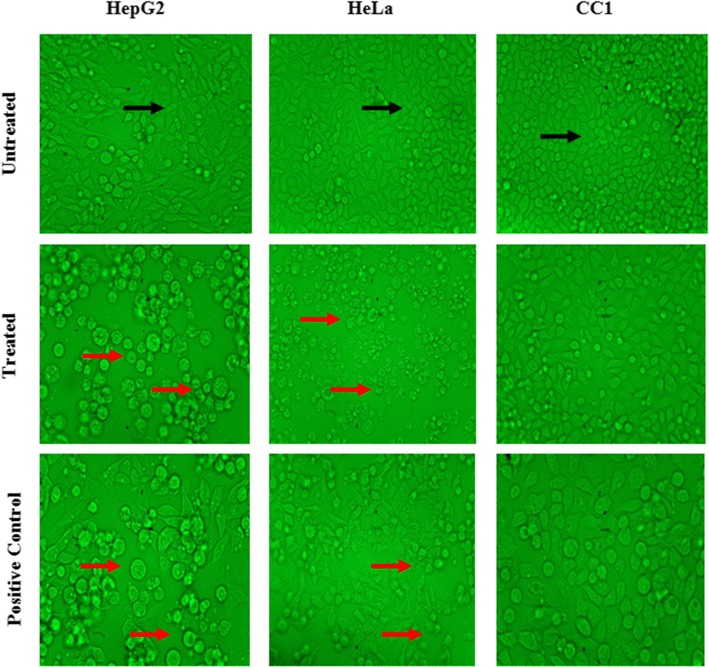
Light microscopy images of HepG2, HeLa and CC1 cells treated with their respective EC50 values, with magnification of 40×. (Black arrow indicates healthy spindle shape cells; Red arrow dead and shrinkage cells due to the LPG treatment)
Official websites use .gov
A
.gov website belongs to an official
government organization in the United States.
Secure .gov websites use HTTPS
A lock (
) or https:// means you've safely
connected to the .gov website. Share sensitive
information only on official, secure websites.
Light microscopy images of HepG2, HeLa and CC1 cells treated with their respective EC50 values, with magnification of 40×. (Black arrow indicates healthy spindle shape cells; Red arrow dead and shrinkage cells due to the LPG treatment)