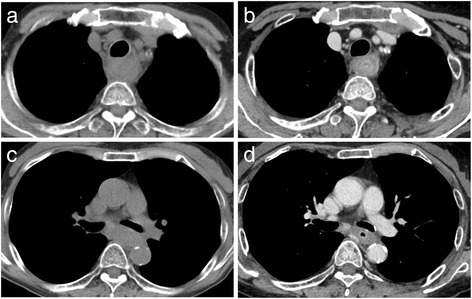
Fig. 3.

Computed tomography (CT) after AEN showed circumferential wall thickening of the upper to the lower thoracic esophagus: upper esophagus (a) and middle esophagus (b). Two years after AEN, a CT scan showed similar findings: upper thoracic esophagus (c) and middle thoracic esophagus (d)
