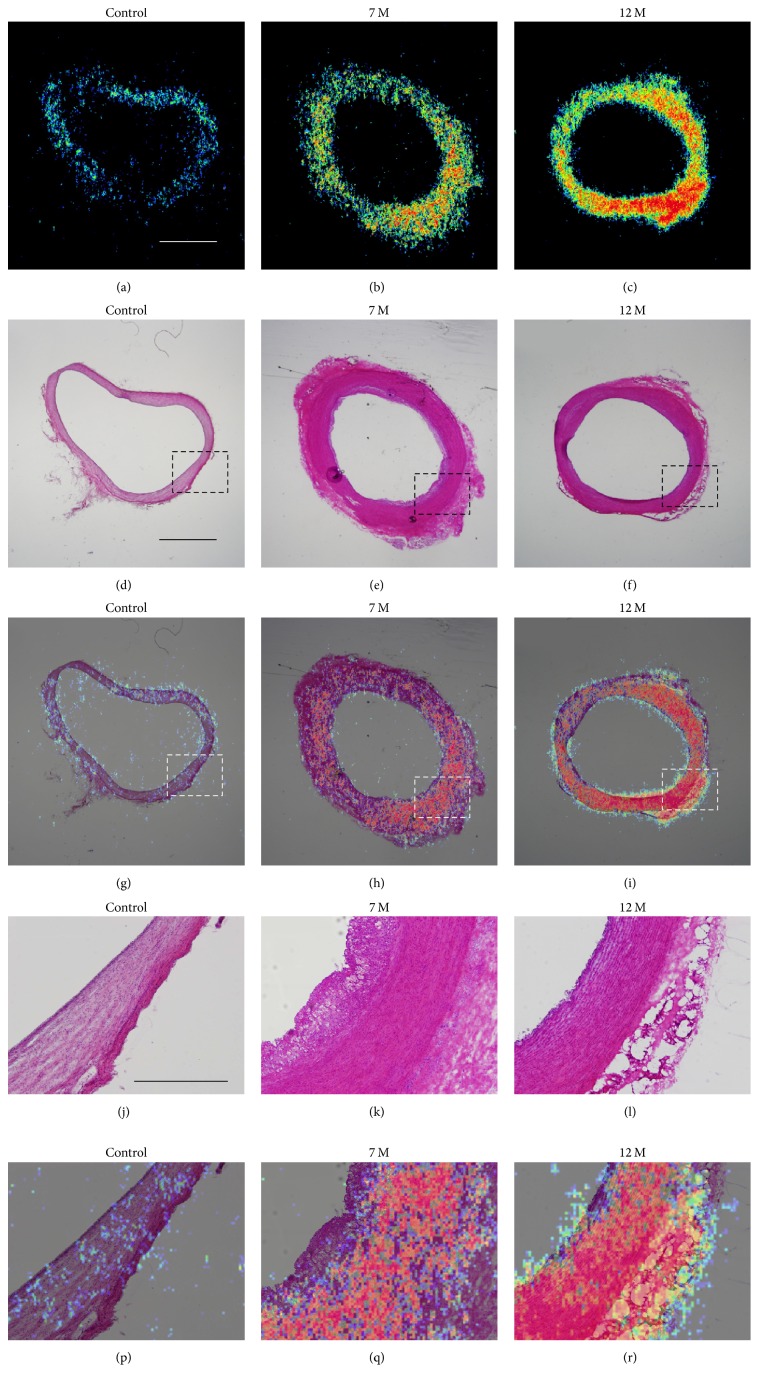
Figure 4.
Localization of [18F]FDG uptake in coronal sections of the thoracic aorta. Macro-autoradiograms with [18F]FDG (a–c), H&E staining (d–f), and merged images (g–i). Tissues from control animals (a, d, g) and animals fed a high-cholesterol diet for 7 (b, e, h) and 12 months (c, f, i). (j–o) are the corresponding sections from dashed box regions of (d–i), respectively. (a–i), bar = 2 mm; (j–o), bar = 300 μm.

