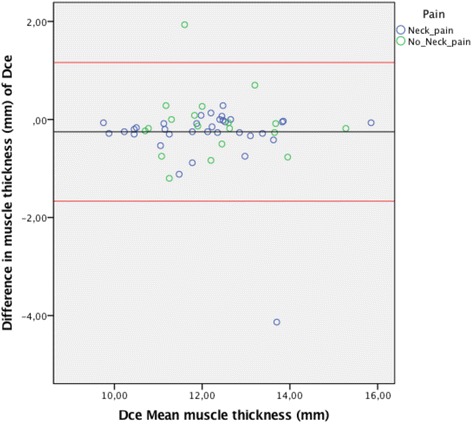
Fig. 5.

Bland & Altman Plot with LoA for the right Dce muscle showing agreement between the 4 raters for measurements of thickness on the same image. (N = 53 subjects, 212 ratings). The mean difference was calculated from the 6 pair of comparison of the different examiners and the mean thickness were calculated for the four raters
