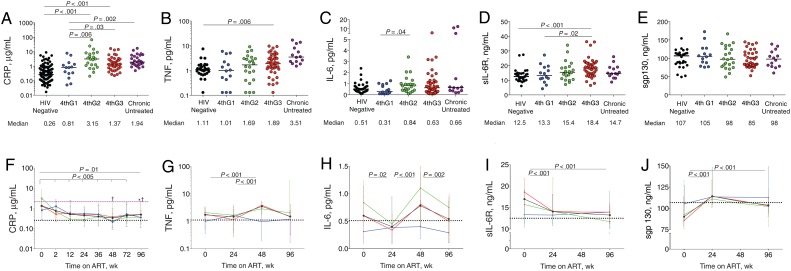
Figure 1.
Inflammatory biomarker levels in human immunodeficiency virus (HIV)–uninfected participants from Thailand (black dots); in participants with acute HIV infection diagnosed in fourth-generation stage 1 (4thG1; blue), stage 2 (4thG2; green), or stage 3 (4thG3; red); and in participants with chronic untreated HIV infection (purple). A–E, Plasma biomarker levels at study entry before starting antiretroviral therapy (ART), including C-reactive protein (CRP) (A), tumor necrosis factor (TNF) (B), interleukin 6 (IL-6) (C), soluble IL-6 receptor (sIL-6R) (D), and soluble gp130 (sgp130) (E). Horizontal bars represent median values. F–J, Changes in the same plasma biomarker levels over 96 weeks of ART initiated during acute HIV infection. Purple dashed line represents median biomarker level in participants during treated chronic HIV infection; black dotted lines, median biomarker levels in HIV-uninfected participants from Thailand. † P < .05 for comparison with treated chronically HIV-infected participants; *P < .05 for comparison with HIV-uninfected participants. Median values are shown with interquartile range bars.

