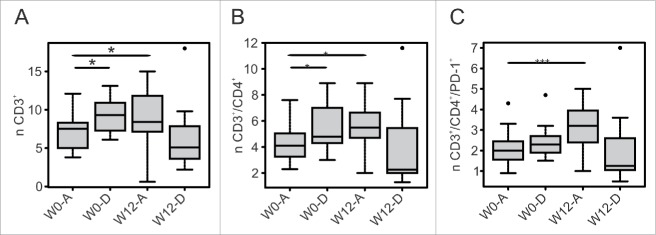
Figure 2.
T cell subsets varied differently in response to ipilimumab according to the survival status of patients. W0 and W12 absolute count (n) of T cell subsets are reported according to the survival status of patients at 1 year (A = alive, D = deceased). Box plot report median, first and third quartiles. Outlier are plotted as individual points. Significance of intra-group variations between baseline and post-treatment values were assed using Wilcoxon Signed Rank test, while the Wilcoxon Rank Sum Test was used to compare inter-group variations (*p ≤ 0.05, **p < 0.01, ***p < 0.001). Values were considered statistically significant for p < 0.05.

