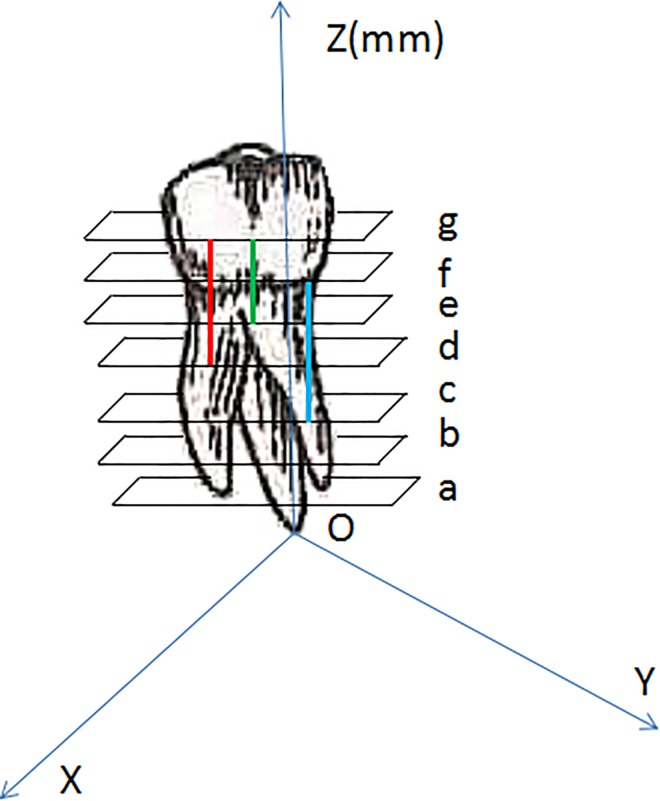
Fig 4. Schematic diagram showing how to calculate the crack depth with micro-CT.
The coordinate system was established based on the root apex as the origin point (O point). The sample was scanned and divided into several average layers. The distance from each layer to the O point was noted and each layer was nominated a, b, c, d, e, f, and g in turn. The cracks were simulated by three lines in the picture. The red line appeared in the d layer for the first time and the g layer for the last time; the length of the line was noted as “g–d”. The green line appeared in the e layer for the first time and the g layer for the last time; the length of the line was noted as “g–e”. The blue line appeared in the c layer for the first time and the f layer for the last time; the length of the line was noted as “f–c”. The cracked length of each sample was measured.

