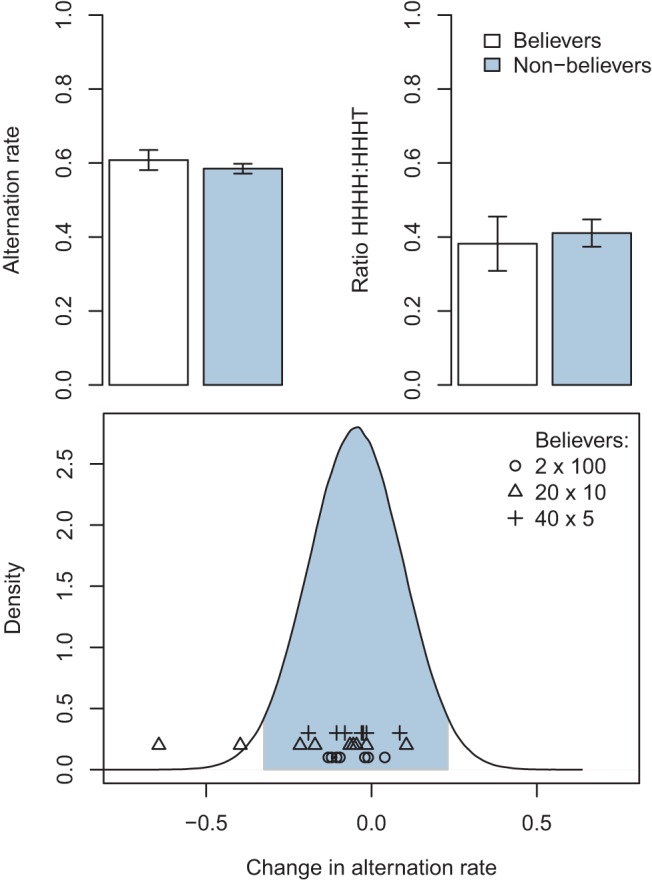
Figure 10.

Top panels: Analysis of the implicit measures of the Gambler’s Fallacy (alternation rate and ratio HHHH:HHHT) in participants who explicitly either believed in the fallacy or not. No difference was found on the implicit measures between believers (n = 27) and nonbelievers (n = 91). These analyses were conducted on participants’ pre-exposure generated data. Bottom panel: Distribution of change in alternation rate from pre- to postexposure for the nonbelievers. The believers are superimposed as data points. The shaded area represents the central 95% of the distribution. See the online article for the color version of this figure.
