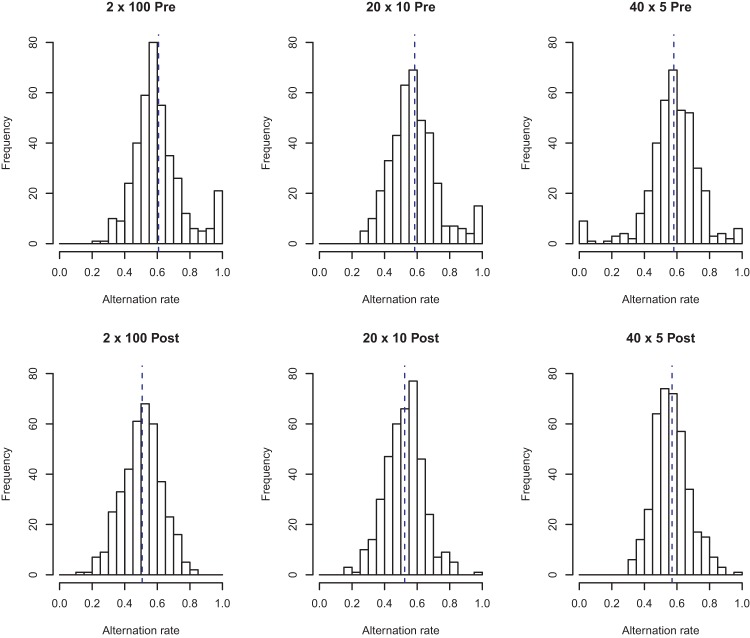
Figure 11.
The alternation rate of participants’ generated sequences. Each participant’s pair of 200-long generated sequences were split into 10 sequences of length 20. These were aggregated within each condition to produce the above histograms. The vertical dashed lines indicate the mean of the distribution. In the 2 × 100 and 20 × 10 conditions, the mean moves closer to the theoretical value of 0.5 postexposure.

