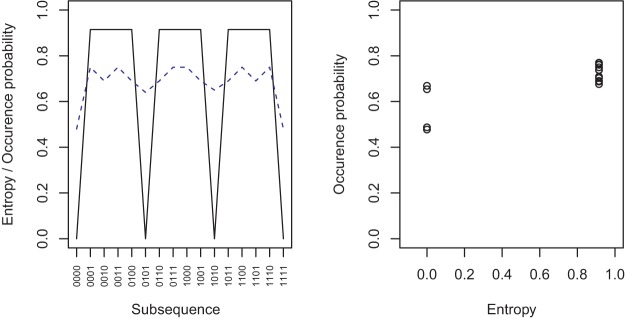
Figure 12.
In the left panel, the solid black line shows the entropy based on the alternation rate of each possible subsequence of length 4. The dashed blue line shows the occurrence probability under the sliding window account (Hahn & Warren, 2009). The right panel shows the relationship between the two measures. The occurrence probability values have jitter added since the symmetry (see left panel) means the points actually overlap perfectly.

