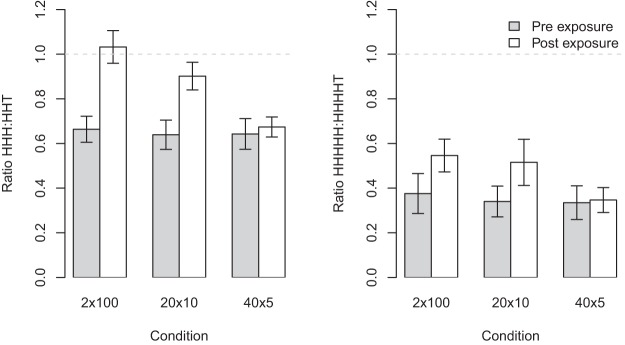
Figure 7.
Left panel: Change in the ratio of runs of length three to runs of length two plus an alternation for sequences produced in each condition (this includes HHH:HHT and TTT:TTH). Right Panel: The same analysis for runs of length five and runs of length 4 plus an alternation. In both panels the 2 × 100 condition shows the largest increase in ratio, while the 40 × 5 conditions shows the smallest increase. The horizontal dashed line shows the theoretical value for a fair coin. Error bars represent ±1 SE.

